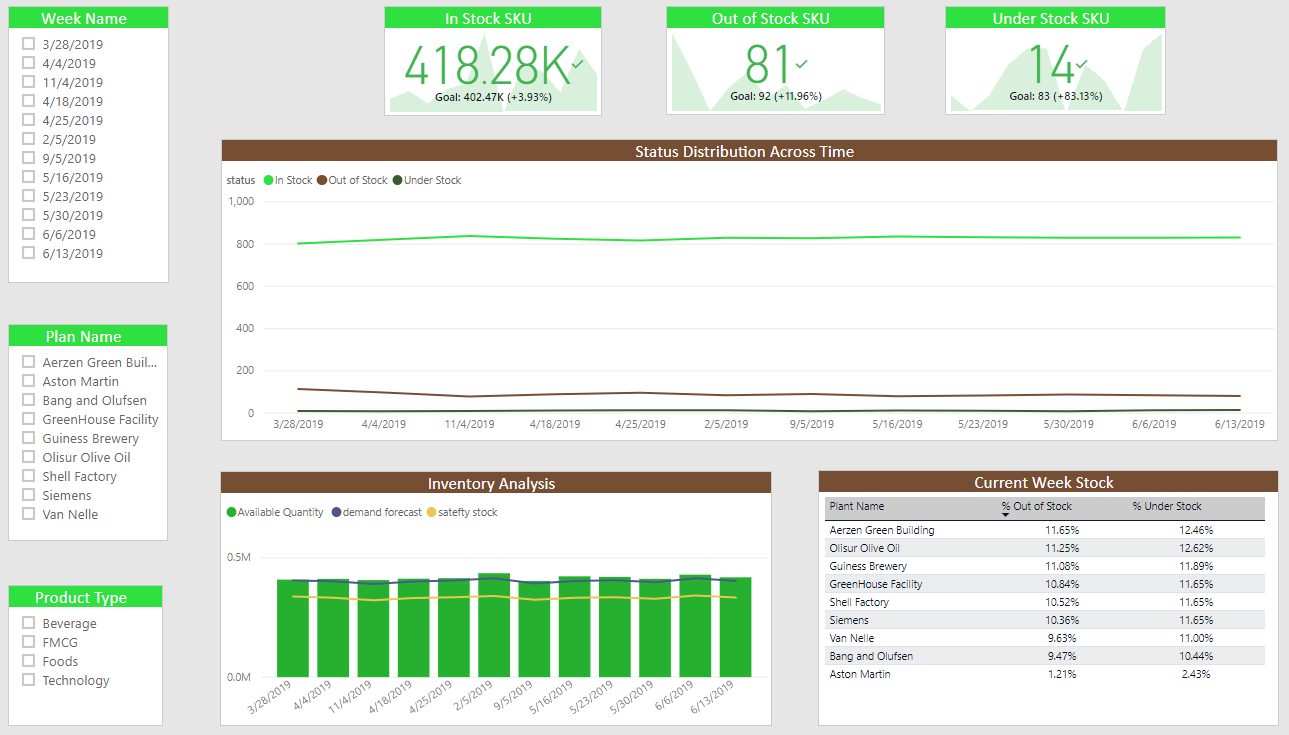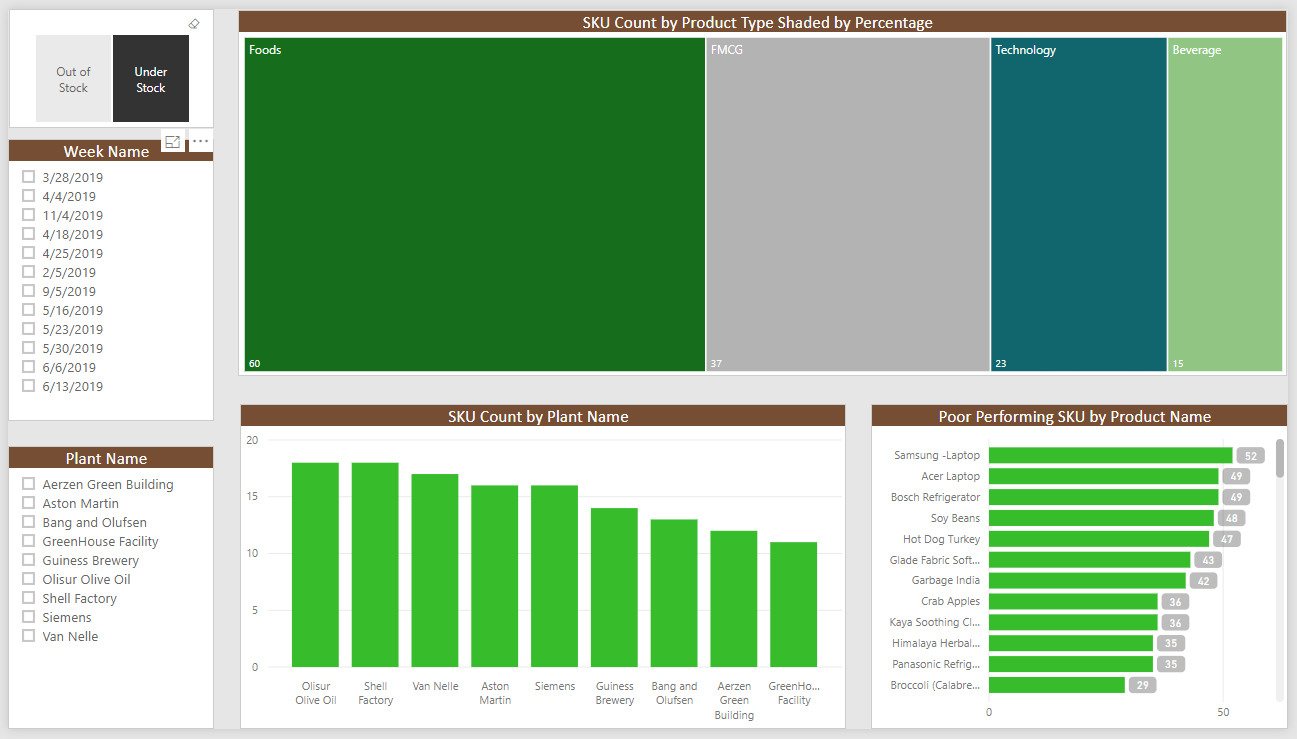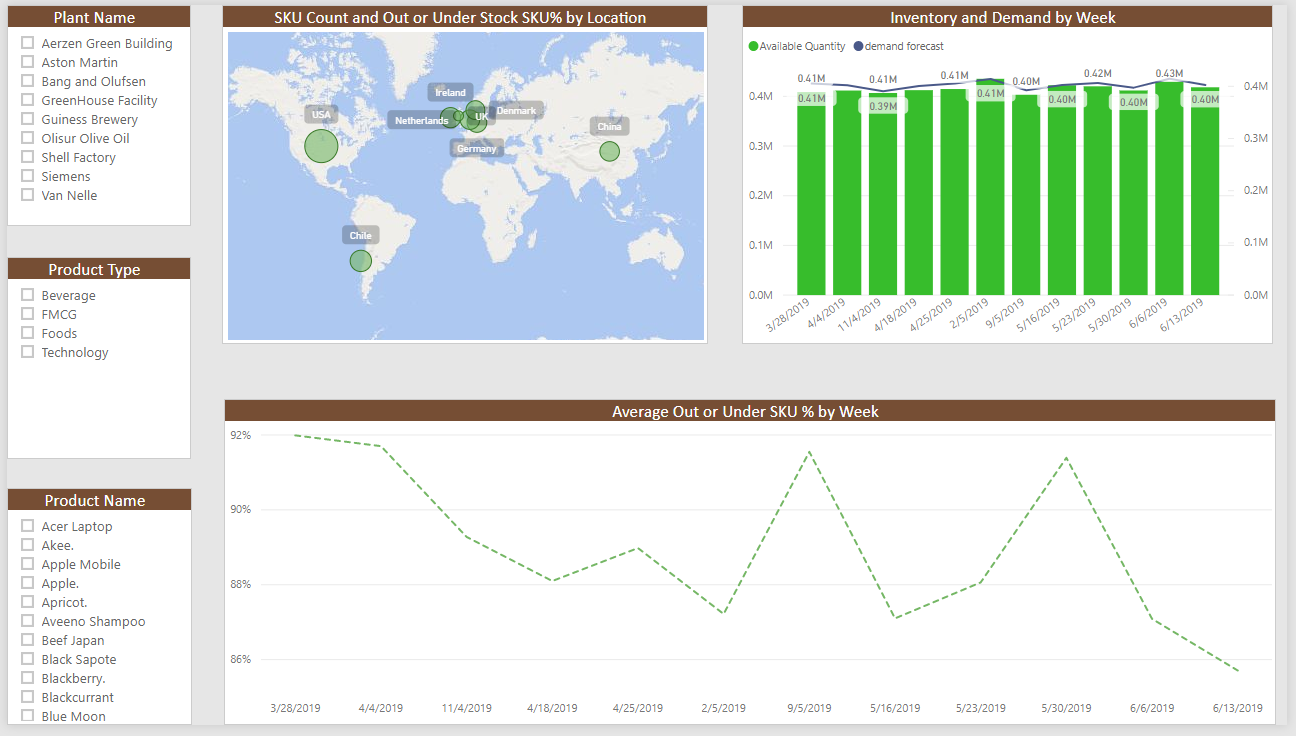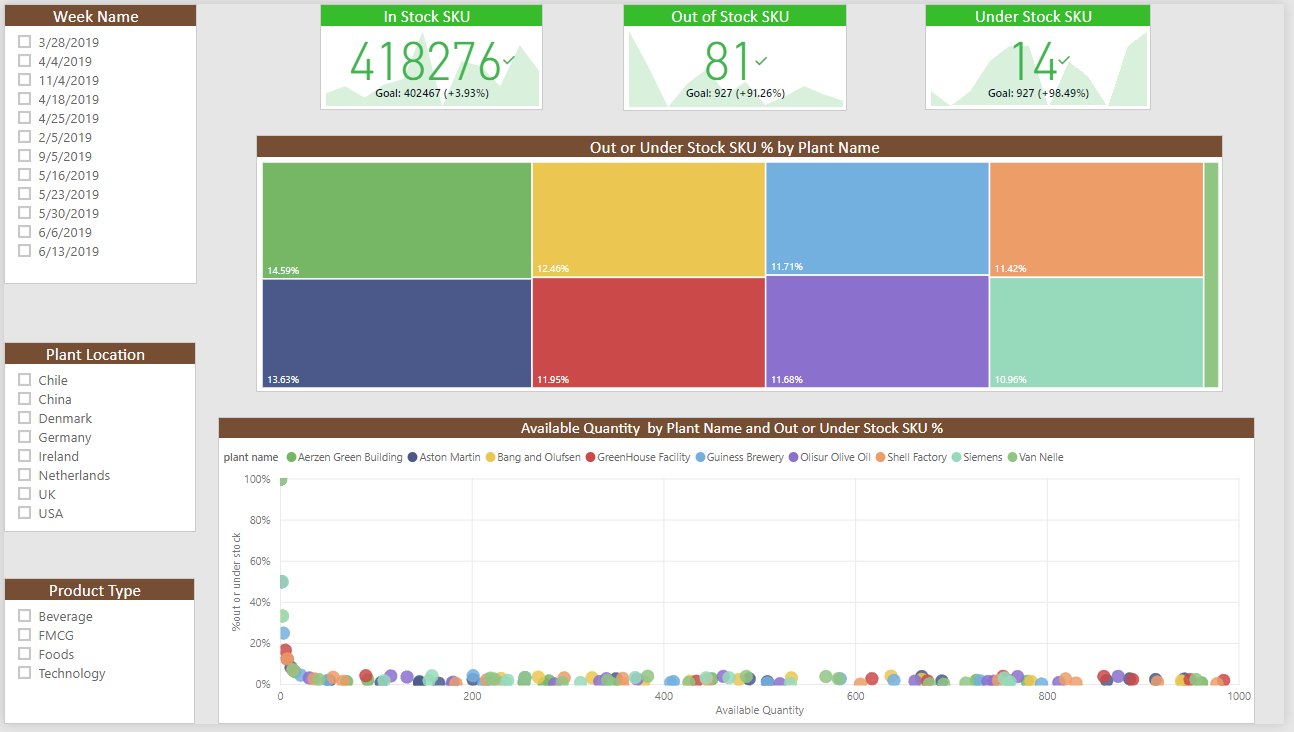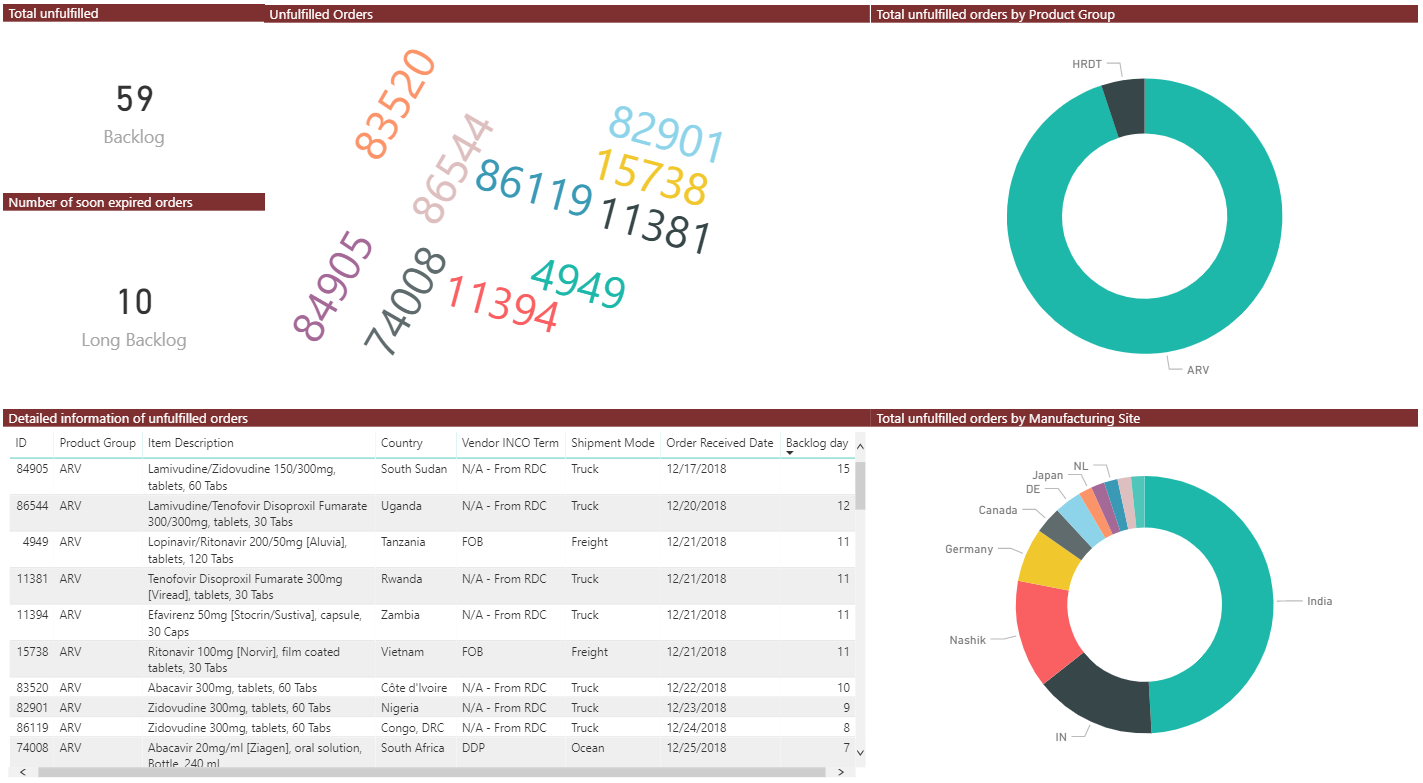
To be a good Inventory Manager is not only to well arrange everything but also to make accurate prediction of supply and demand. To get that, it is important to manage all the information on poor performance SKUs or plants. Access all those with a laptop, a web browser or just a mobile app.
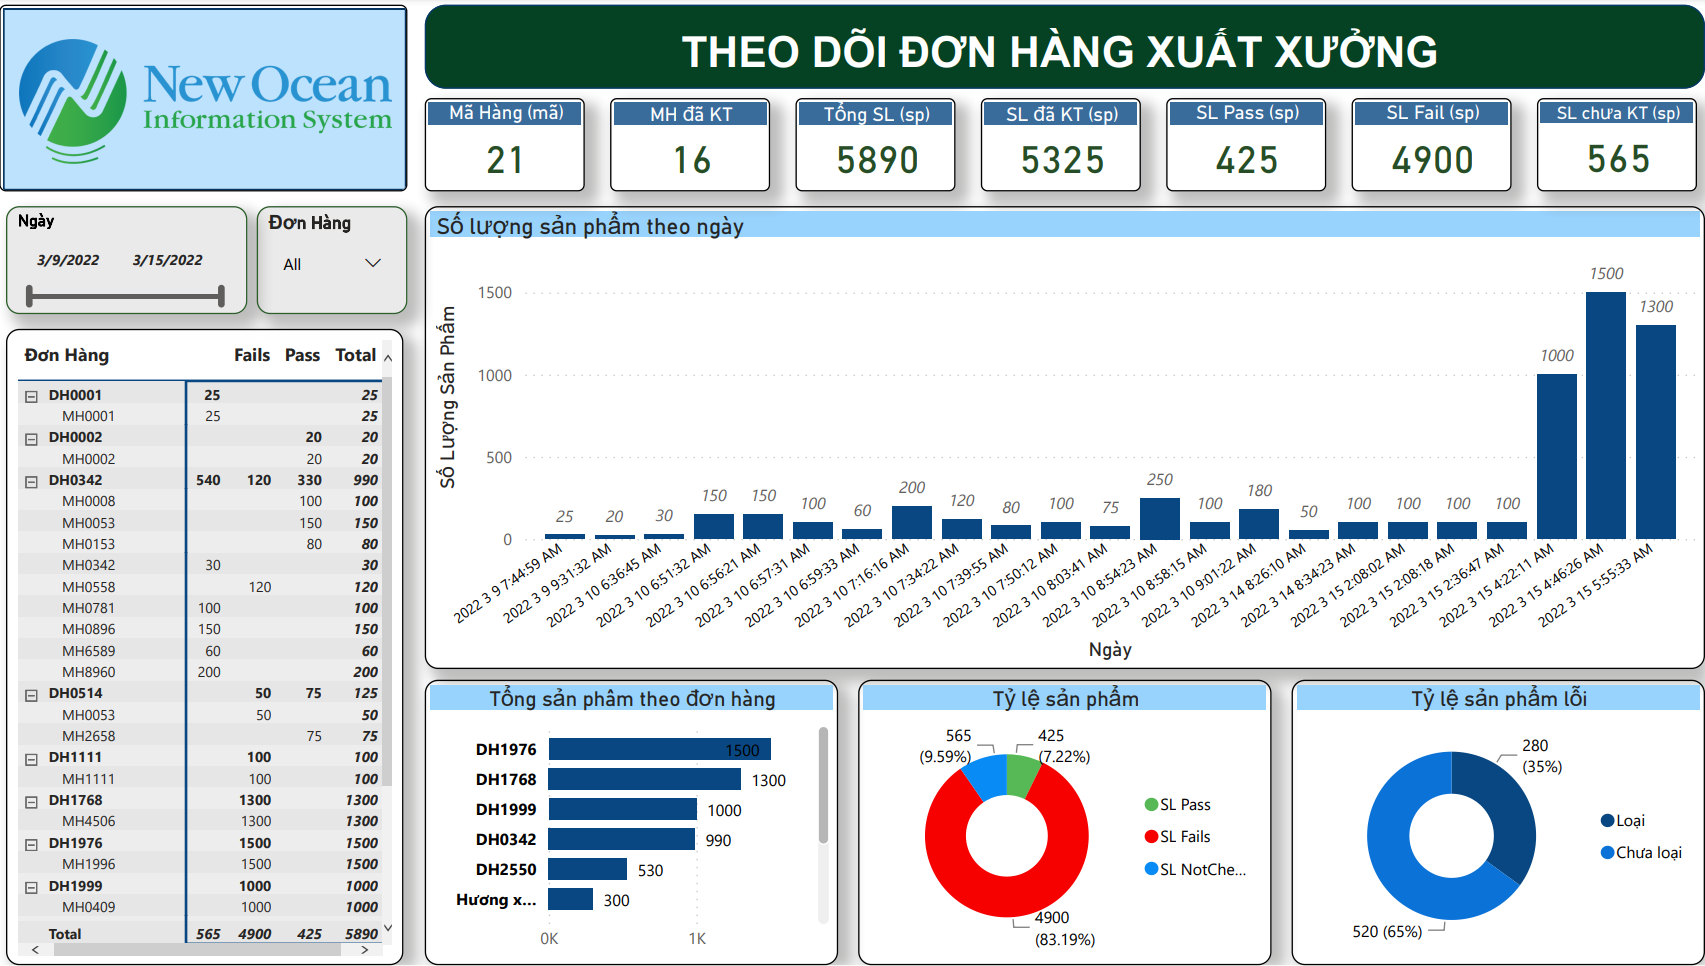
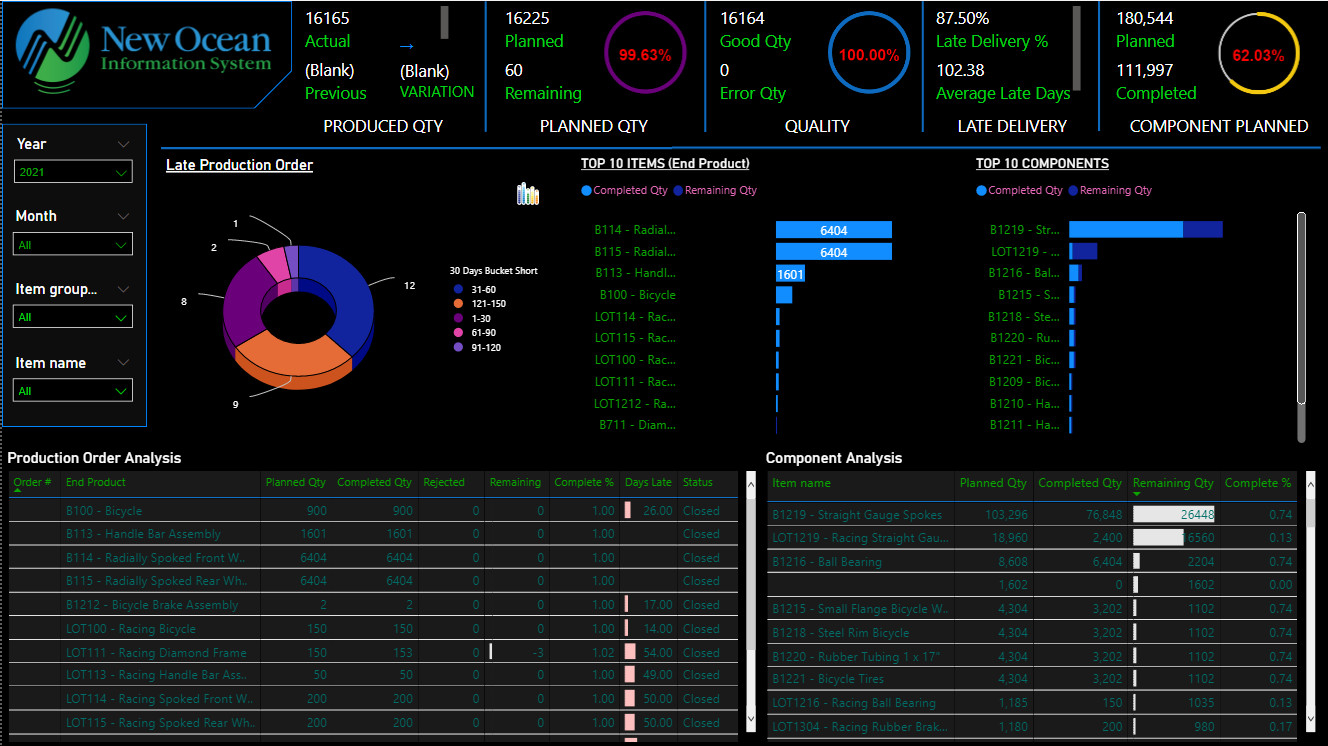
Order management has long been perceived as one of the most important issues of any company because it helps managers control not only product quality but also order quantity. Therefore, they can understand the company’s production activity as well as market needs better and make more optimal strategies, which plays a primary role in pushing the company’s profit. With Power BI, data is visualized by specific charts helping users be easier and more convenient when they experience it.
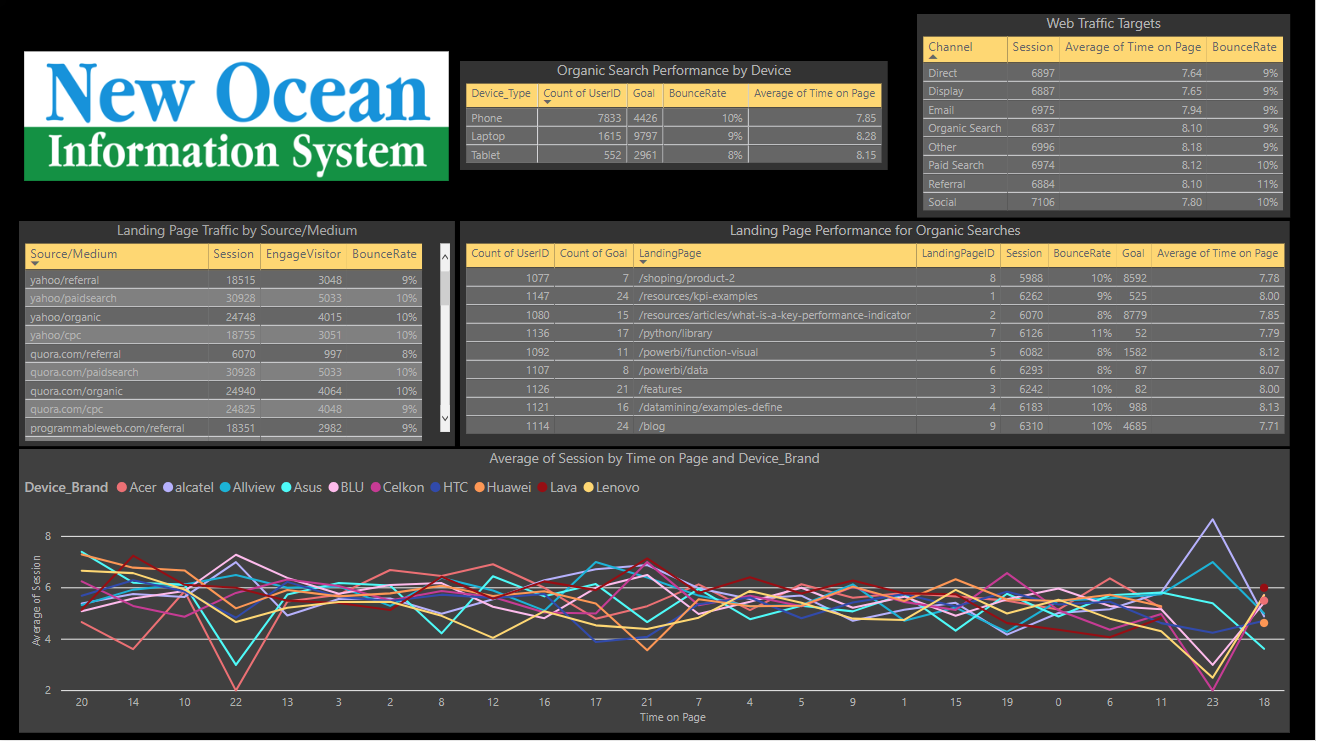
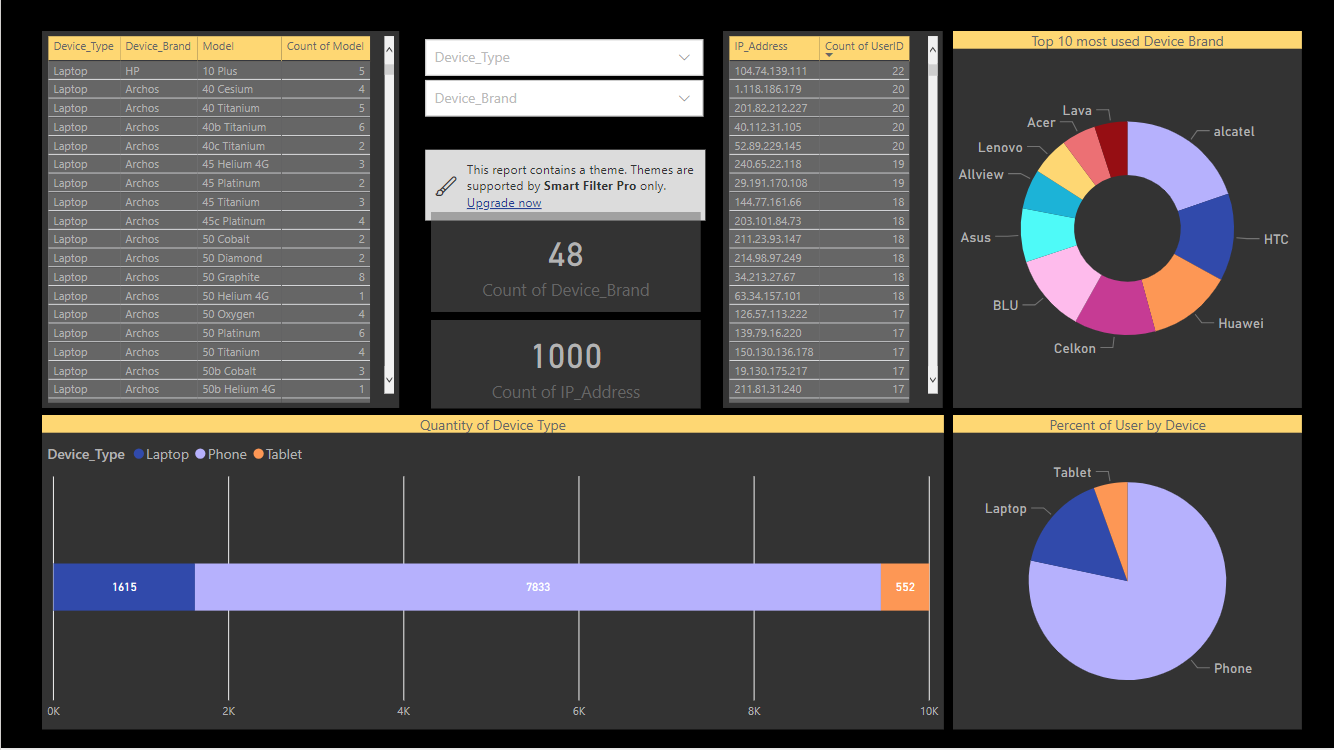
In digitization age, trackers such as Google Analytic, Amplitude Analytic... effectively help you monitor the your site's performance. From hundreds of messy APIs and measures collected, NOIS Analytic report service builds you a powerful data warehouse, grants you a friendly and interactive view of your business, what is working well and what is not.
Real-time control of your KPIs, On-time decide of your actions.
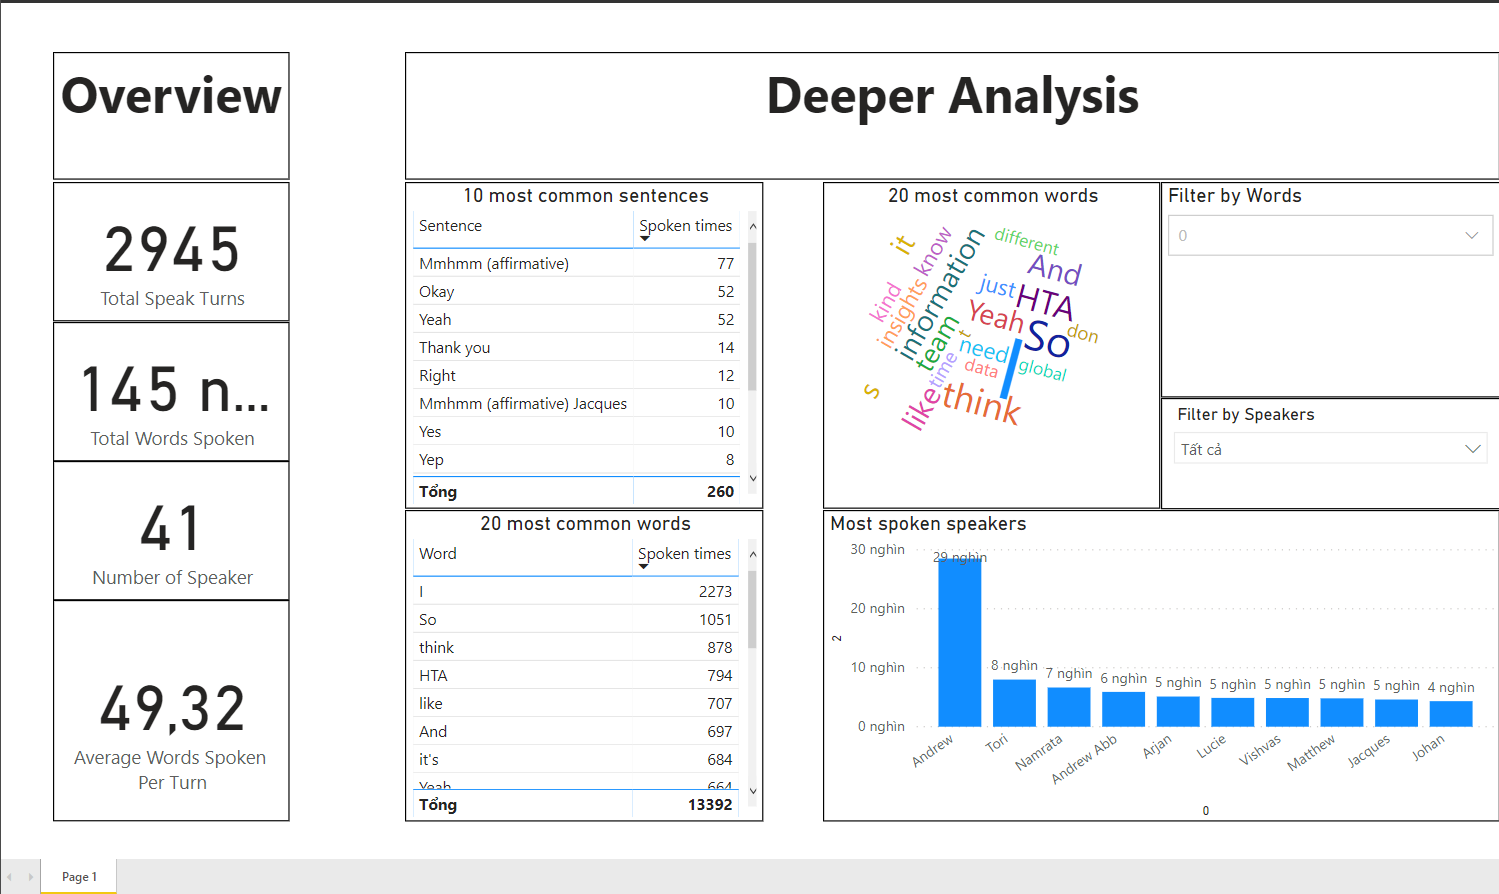
Are you running a Customer Care Service? Or hosting a talk-show? Get an overview, get insights of what everyone is talking about, how they feel or how frequent they speak is the key to measure performance and make decision.
Instead of qualitative test, individual monitoring or survey, let the Analytic Dashboard does such things for you.
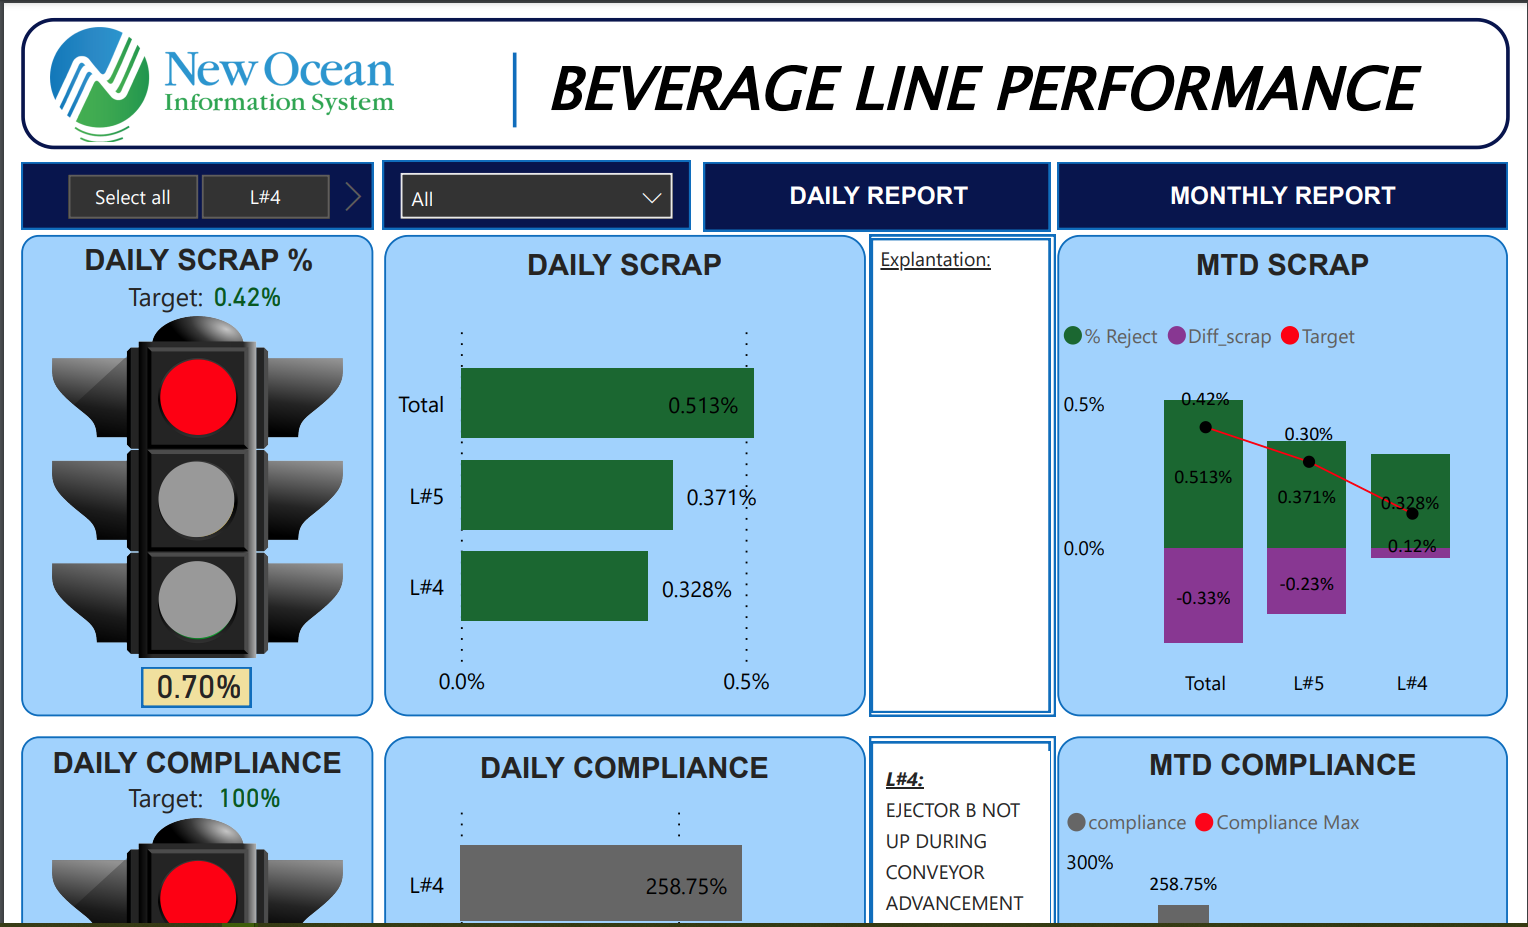
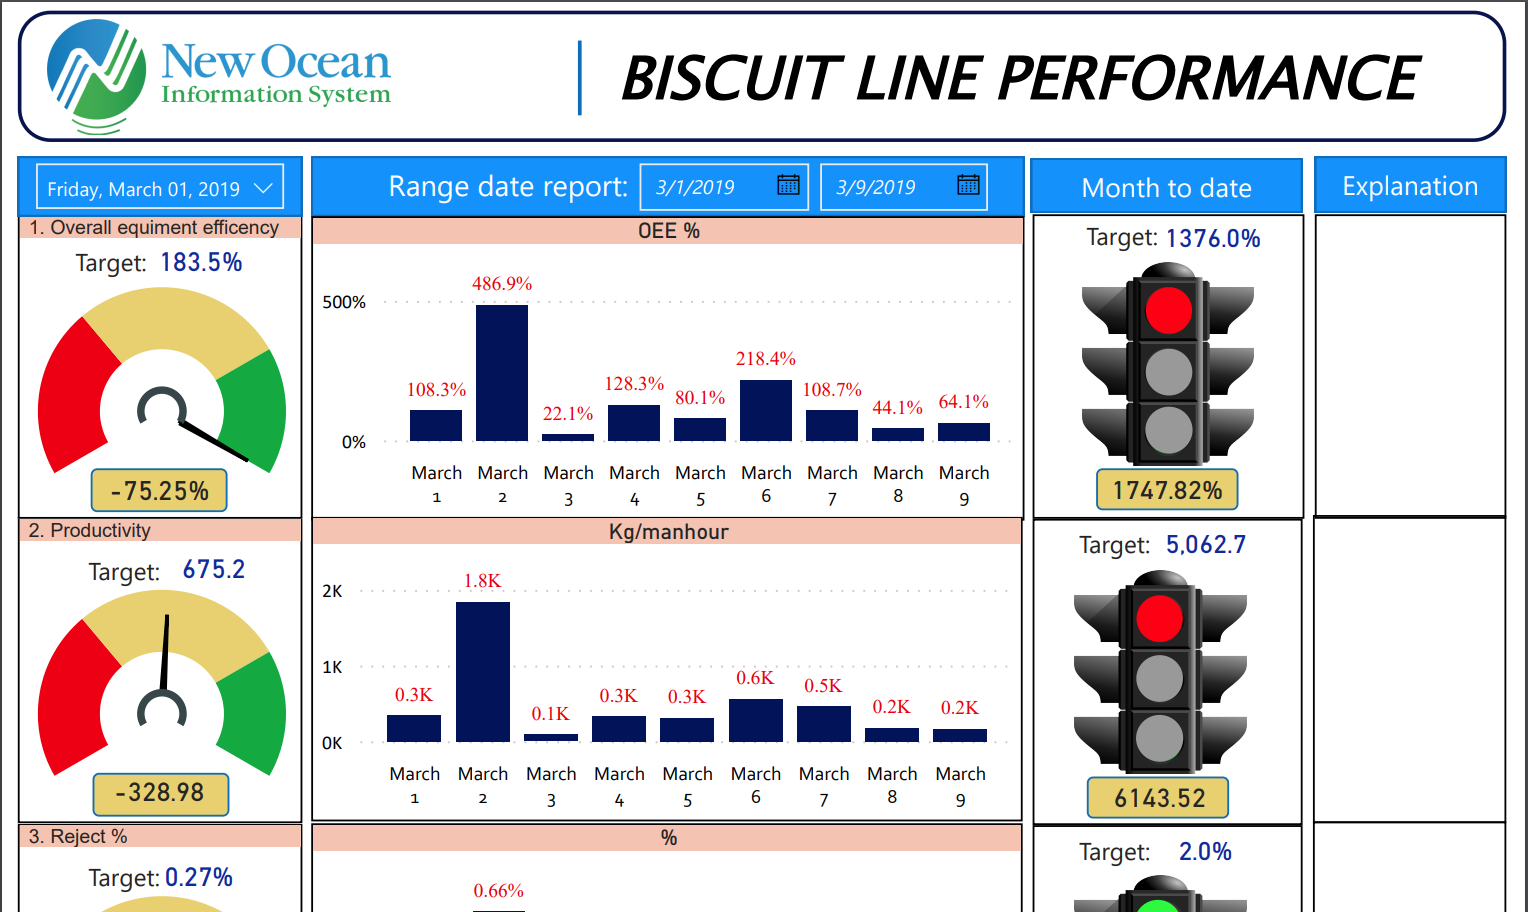
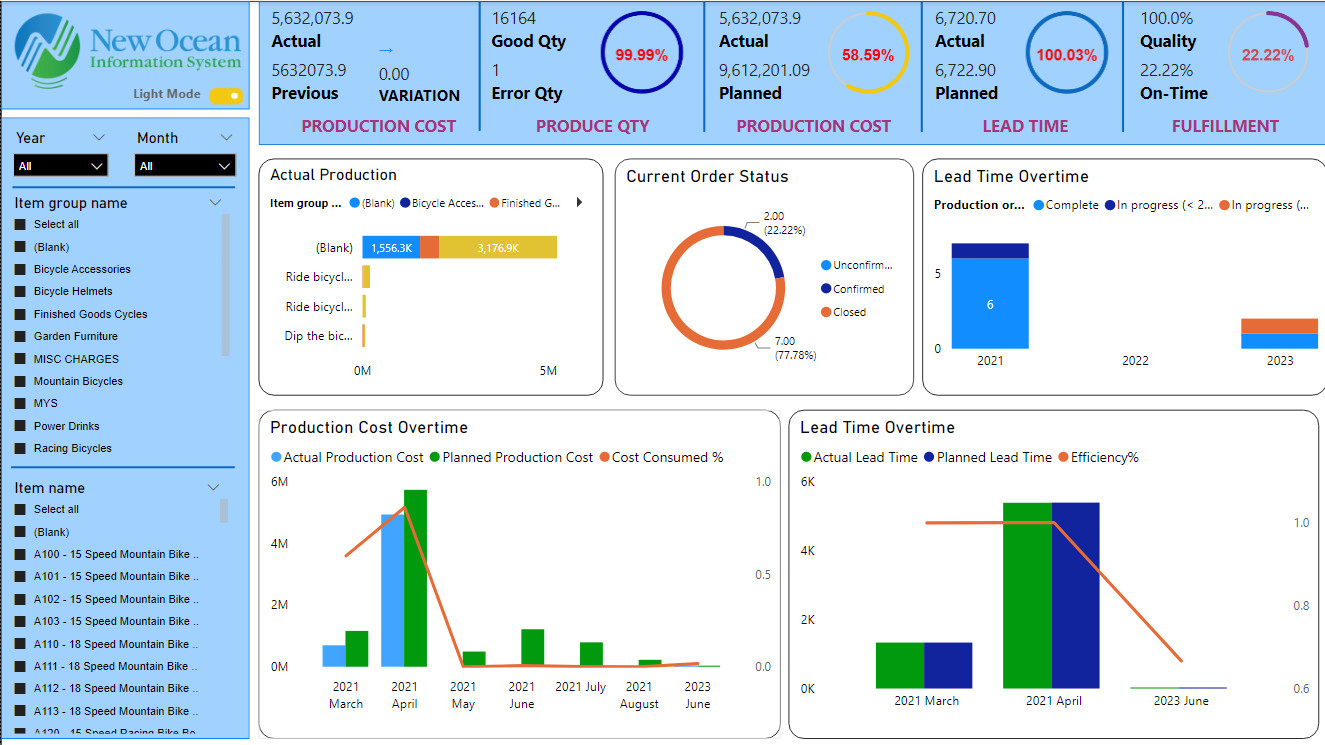
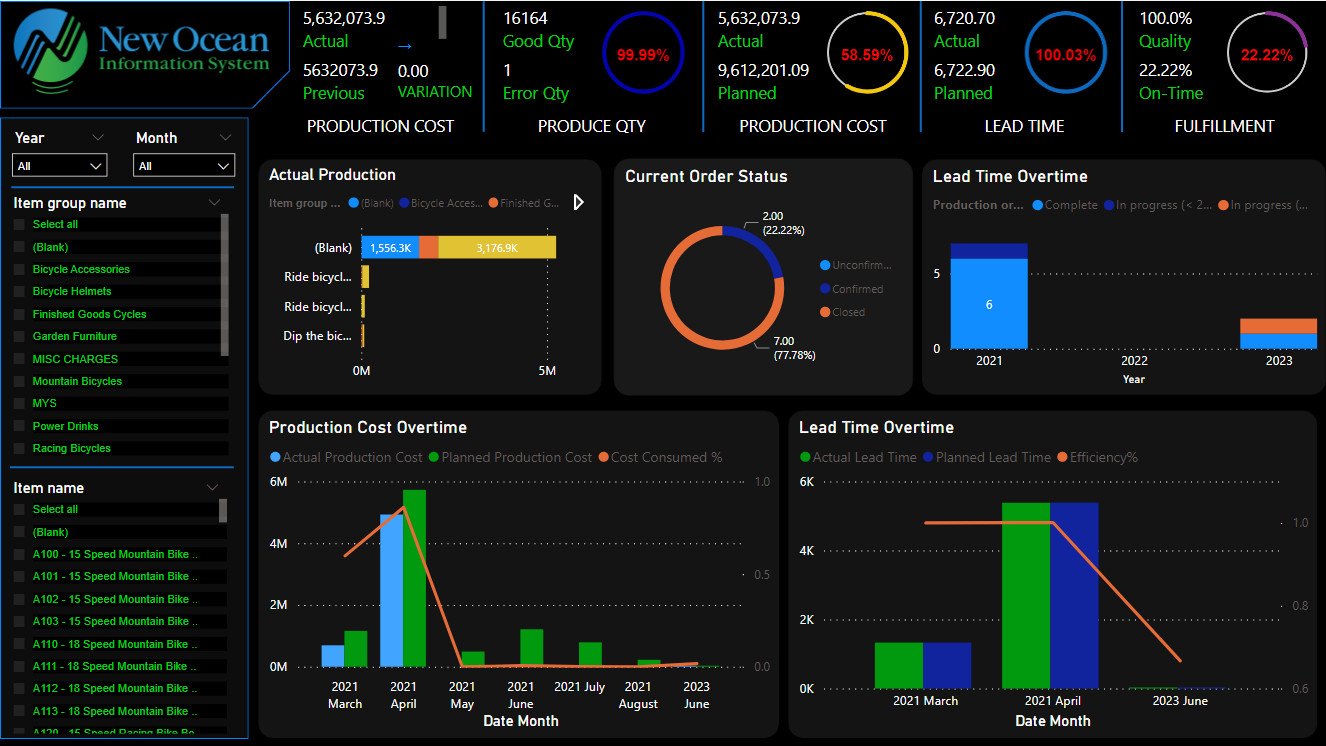
Manufacturing KPIs about OEE, efficiency, performance, etc,...especially important for manufacturers to have an overview and deeper insight so that they can control each production line and make good decisions during the manufacturing period to reduce cost, improve productivity and minimize risk.
NOIS has been a gold partner of domestic and foreign companies in the manufacturing field for more than a decade. We understand the business problem, combined with the power of data analysis by Power Bi to provide profitable solutions and improve production efficiency.
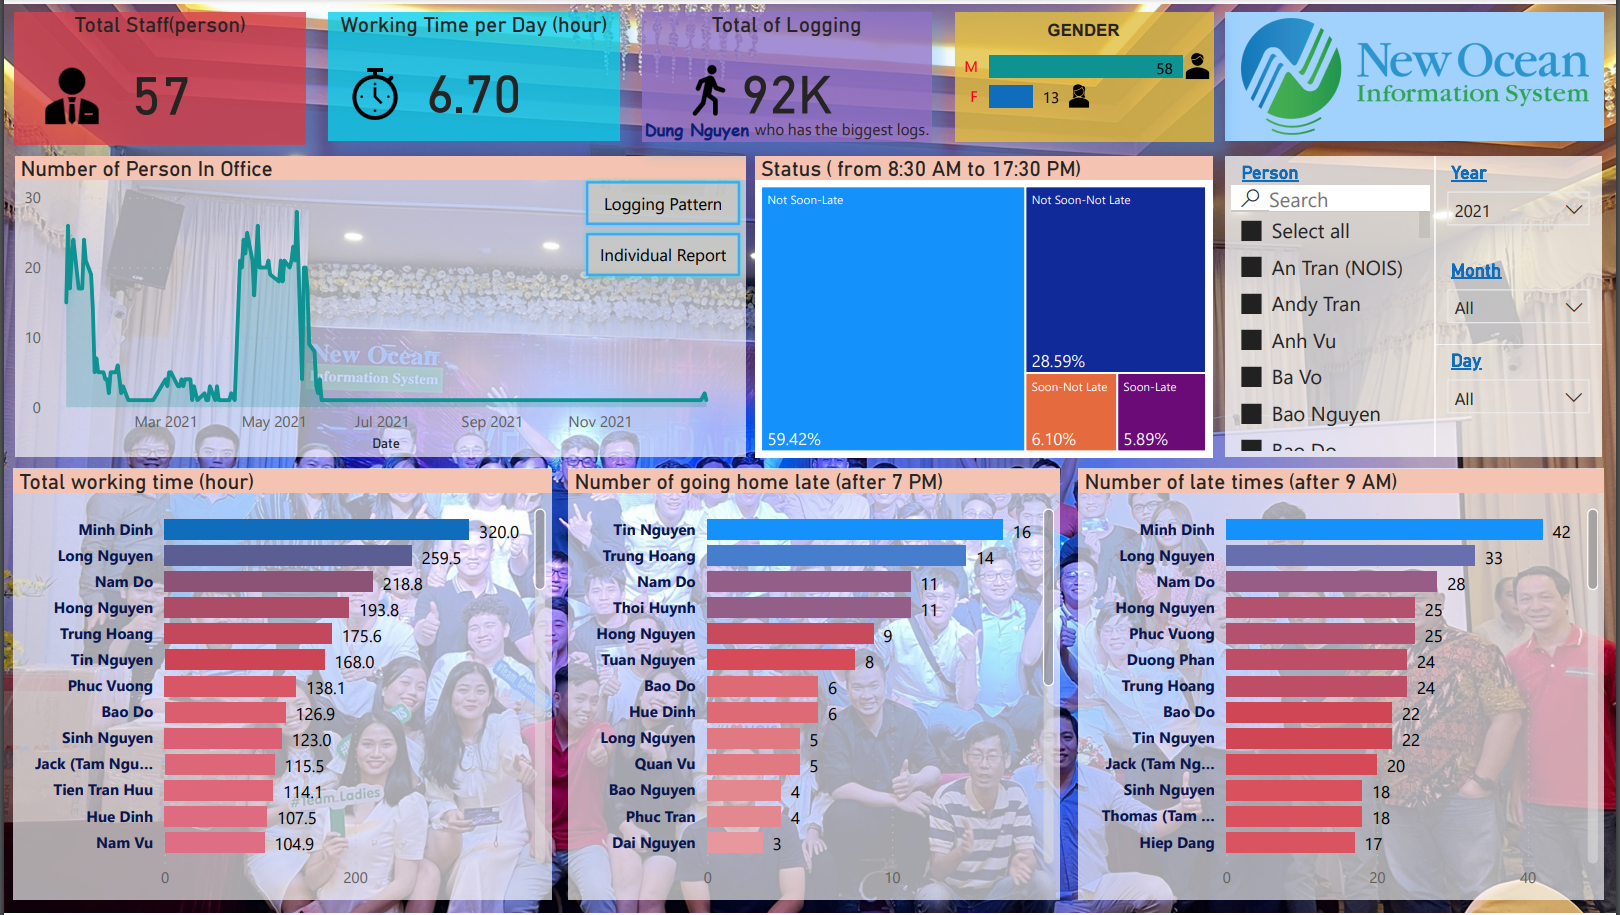
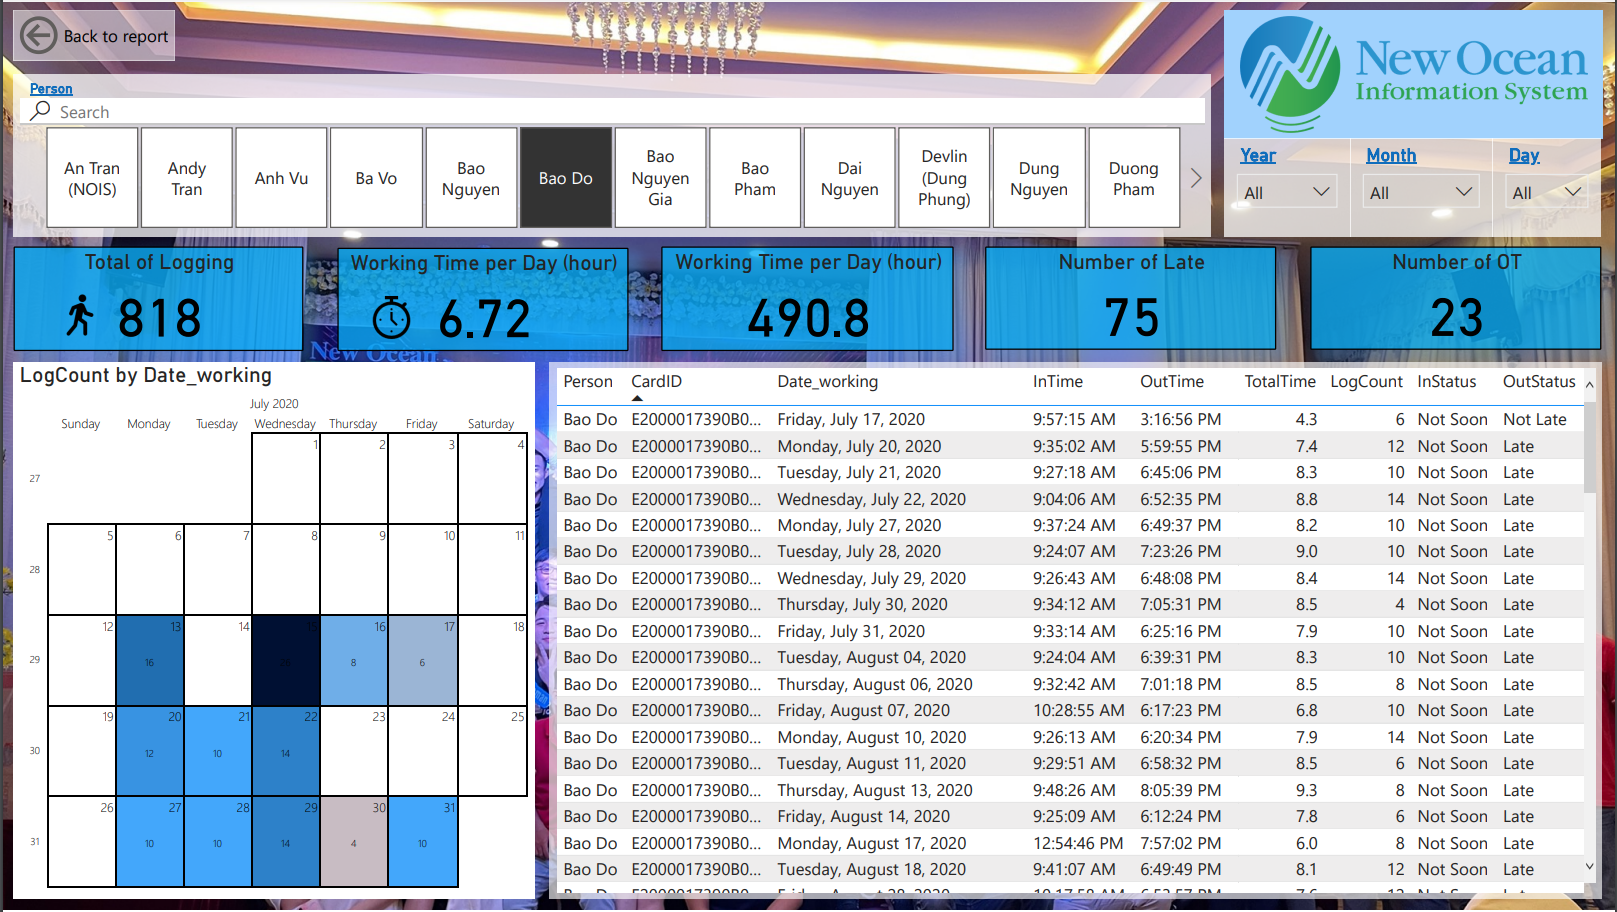
The Locker report will help you manage your staff or client locker assignments. This report lists each locker number with the client name and dates it was assigned. With advanced analytics in Power Bi, we can find logging patterns or frequencies or even individual information for Human Resource Management, Customer behavior & experience...
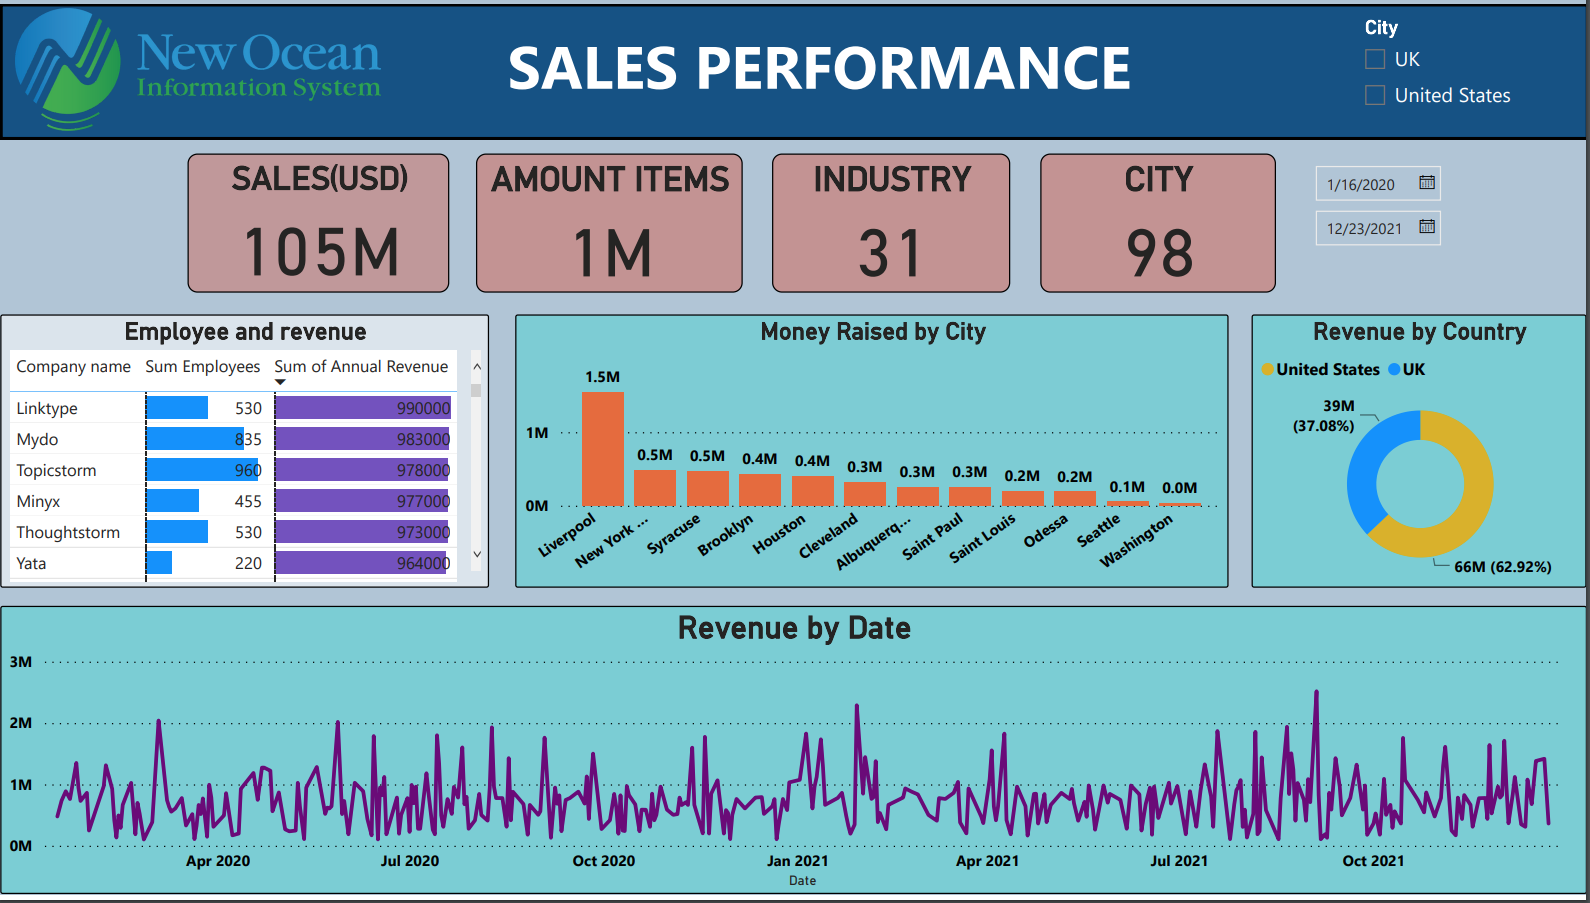
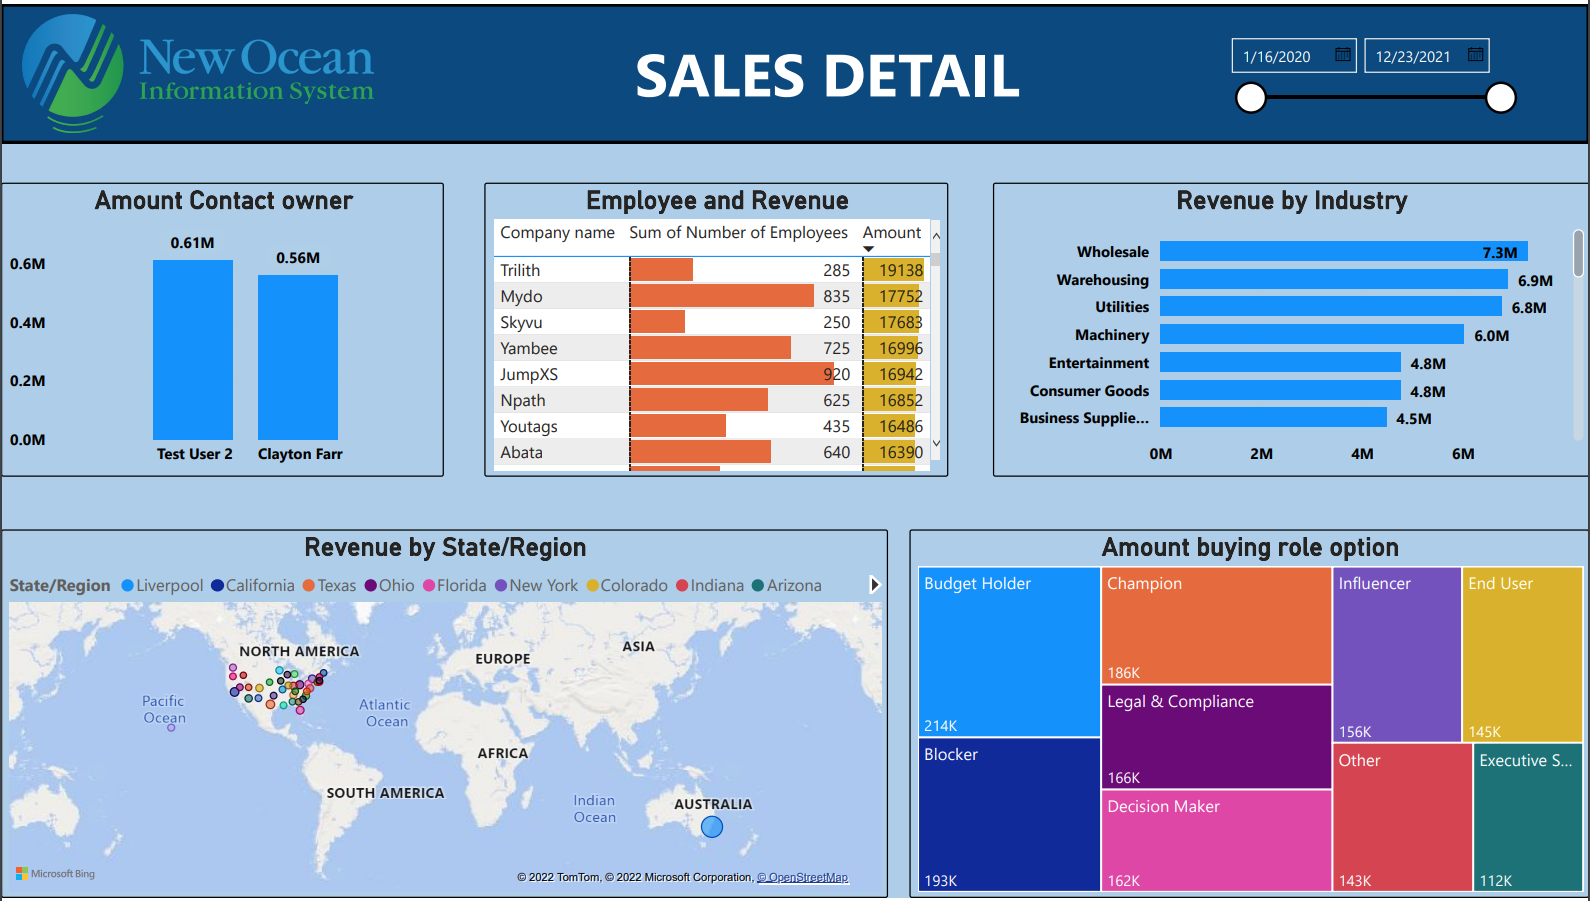
To all companies, Sales Performance and Sales Detail have long been perceived as two of the most important issues that companies have to face regularly because these factors have an enormous impact on the development of companies. With Power BI, Data is visualized by specific charts helping the managers to have an overview and a clear insight into the static of their companies so that they can make better decisions as well as optimal strategies. Therefore, companies not only can push their profit but also create a strong reputation and generate a competitive advantage in the market.
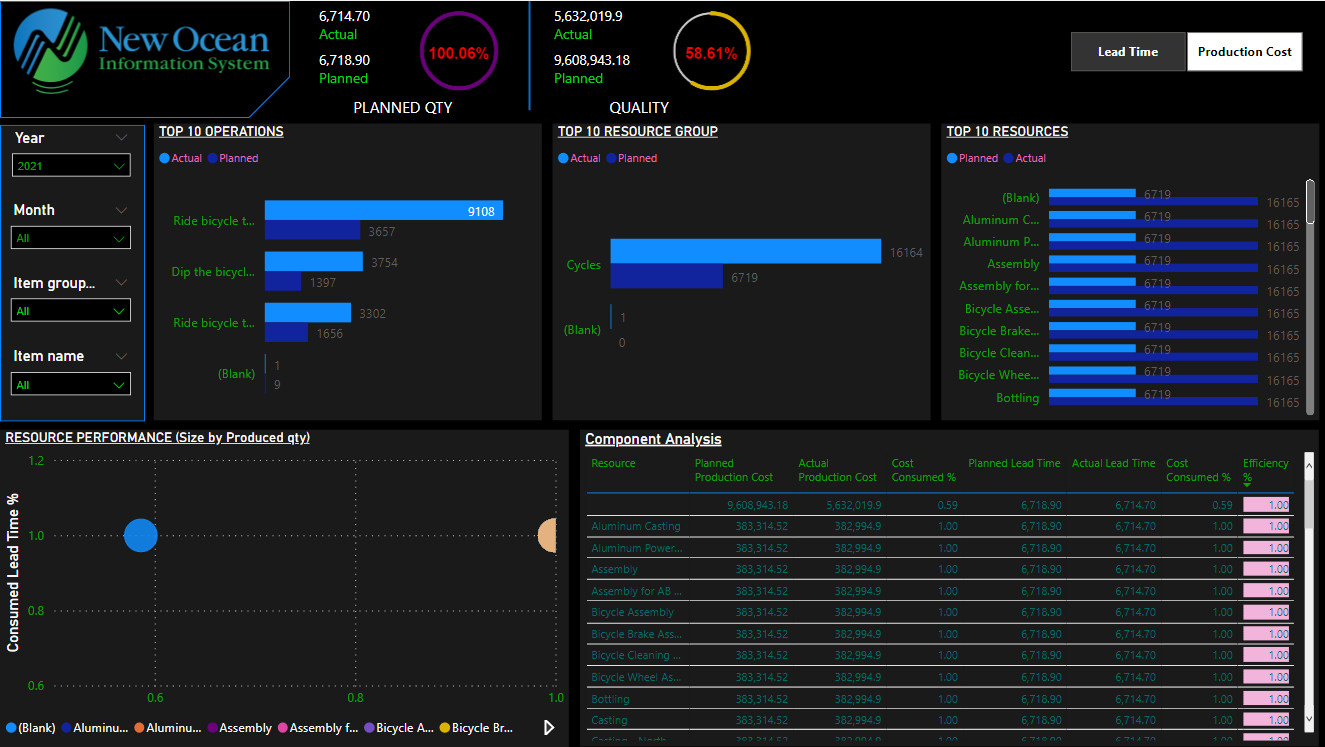
Today's manufacturing leaders are visionaries, pioneering increasingly efficient methods to produce and move physical goods while thinking beyond productivity, cost savings, and risk reduction. Manufacturing analytics solutions from NOIS enable you to tune production operations for those things while capitalizing on data as an asset that helps you deliver innovative services and quality products possible only in the connected economy.
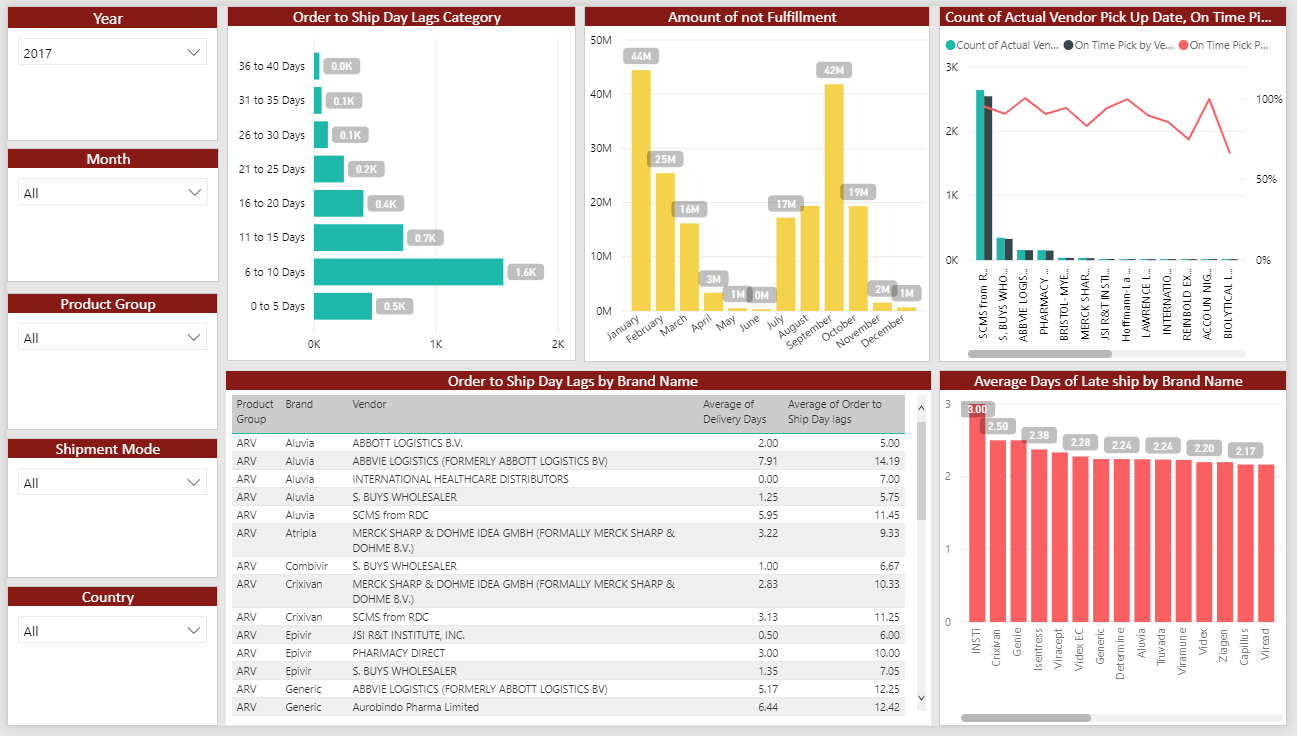
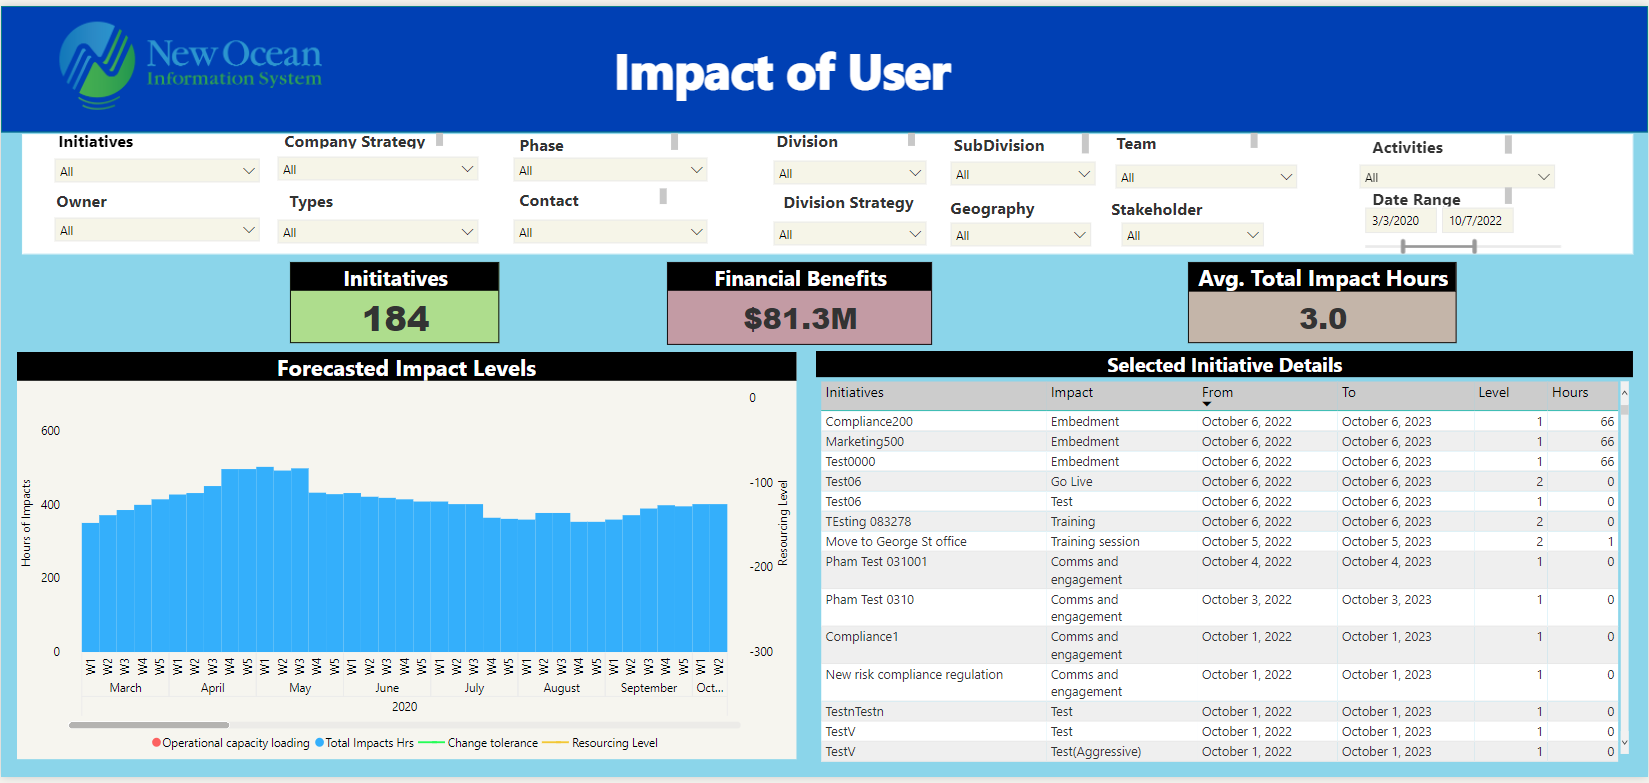
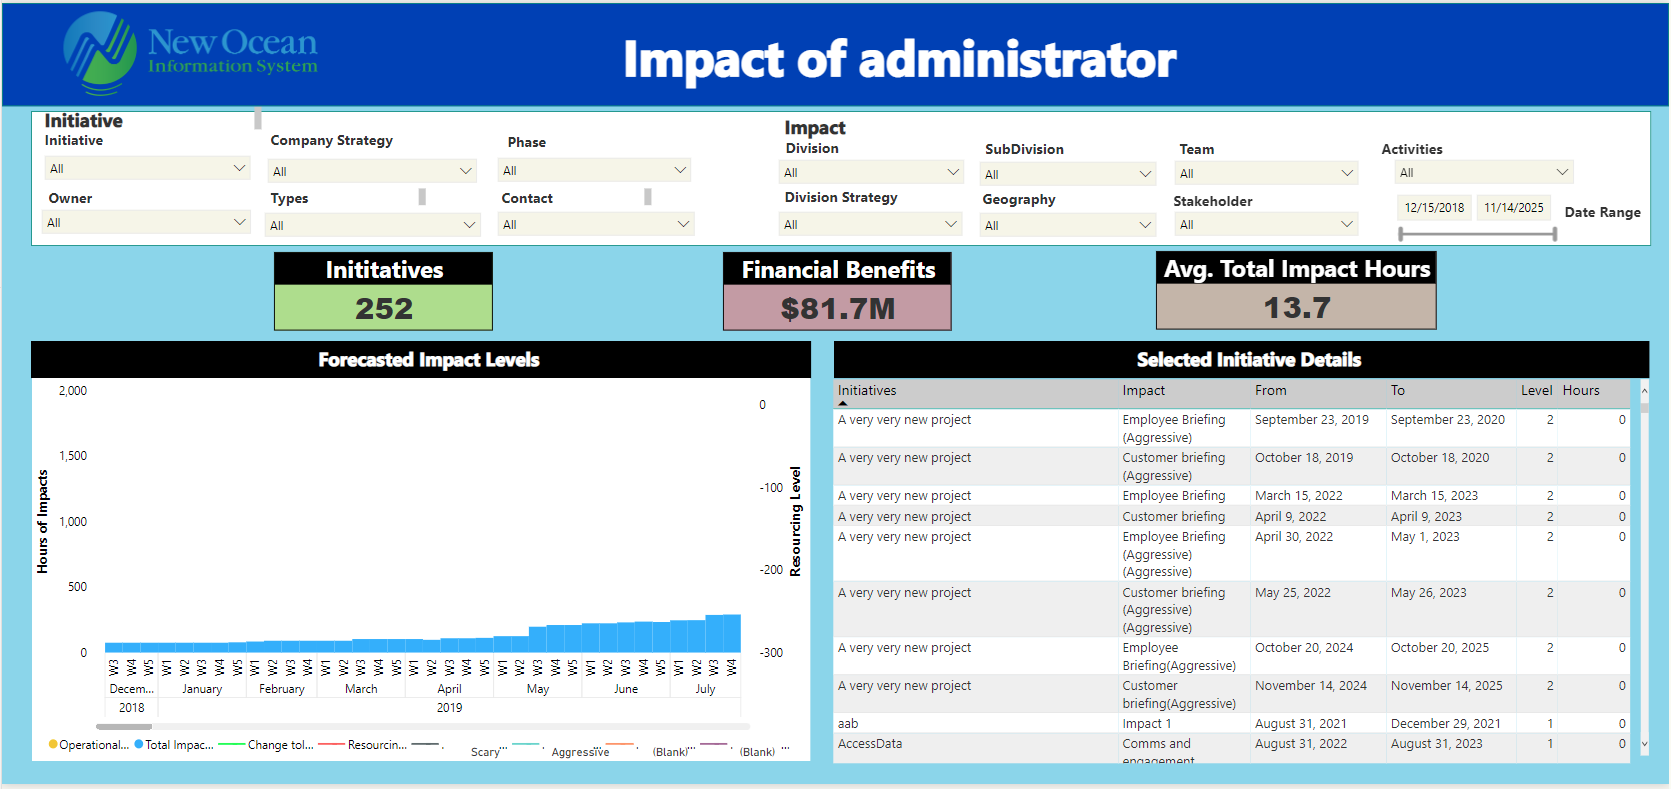
Today, the development of technology gives us more advantages in work. Effective reports help you to understand the progress of the work, as well as the efficiency of the factors in the work. The automation of reports saves time, as well as effort, thereby reducing the resources of enterprises in monitoring and management. In the chart, we give situations to help businesses manage the progress of the project as well as manage the departments to operate the work most effectively. Saving you time as well as existing resources.
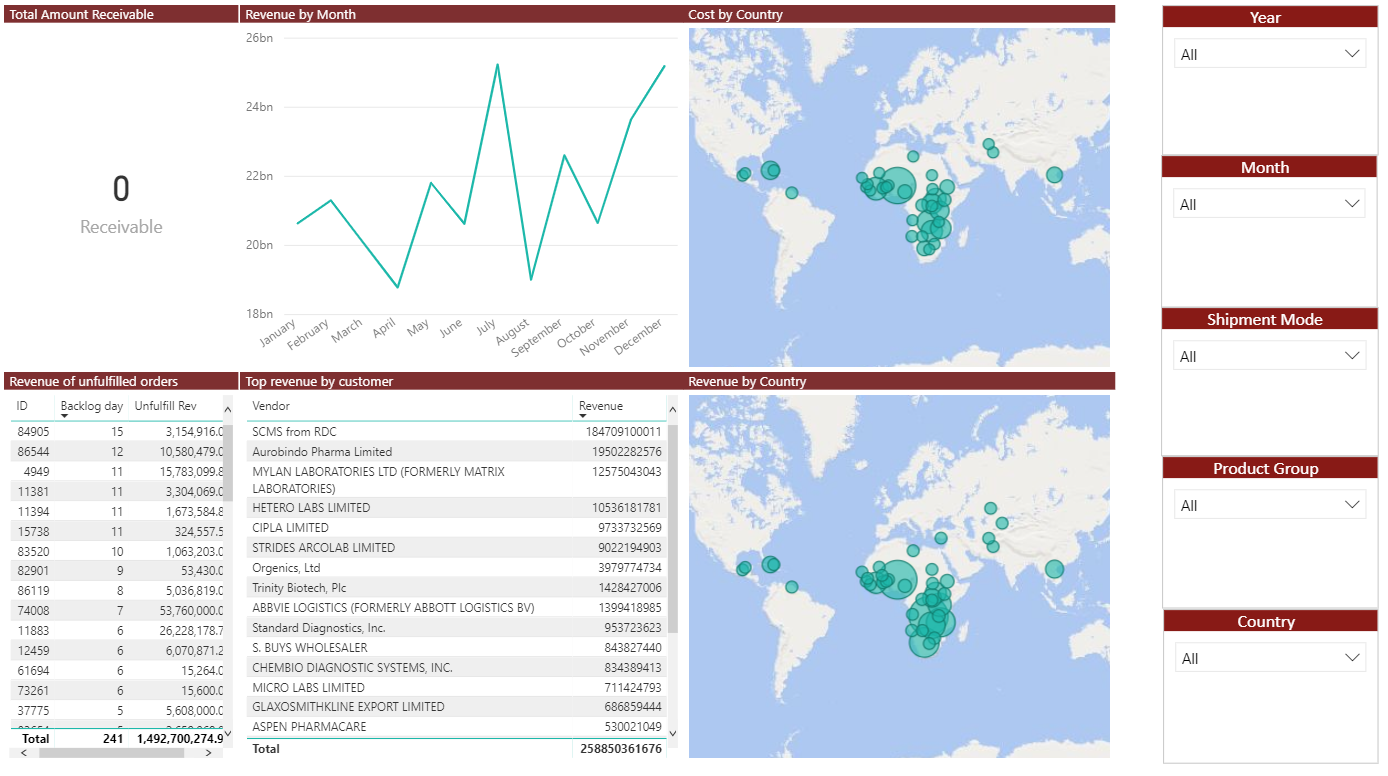
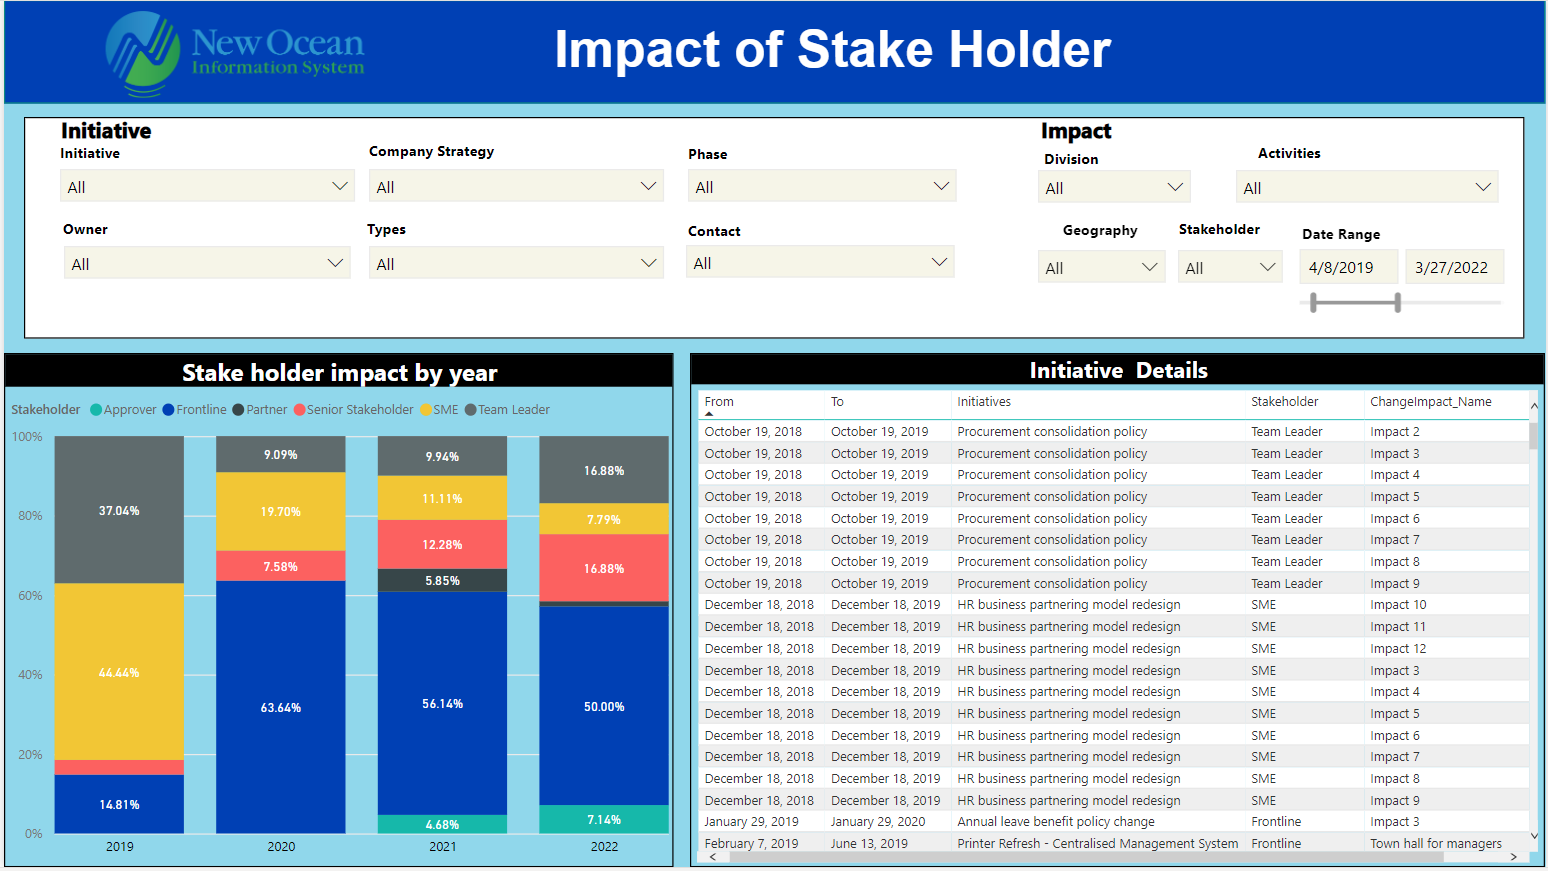
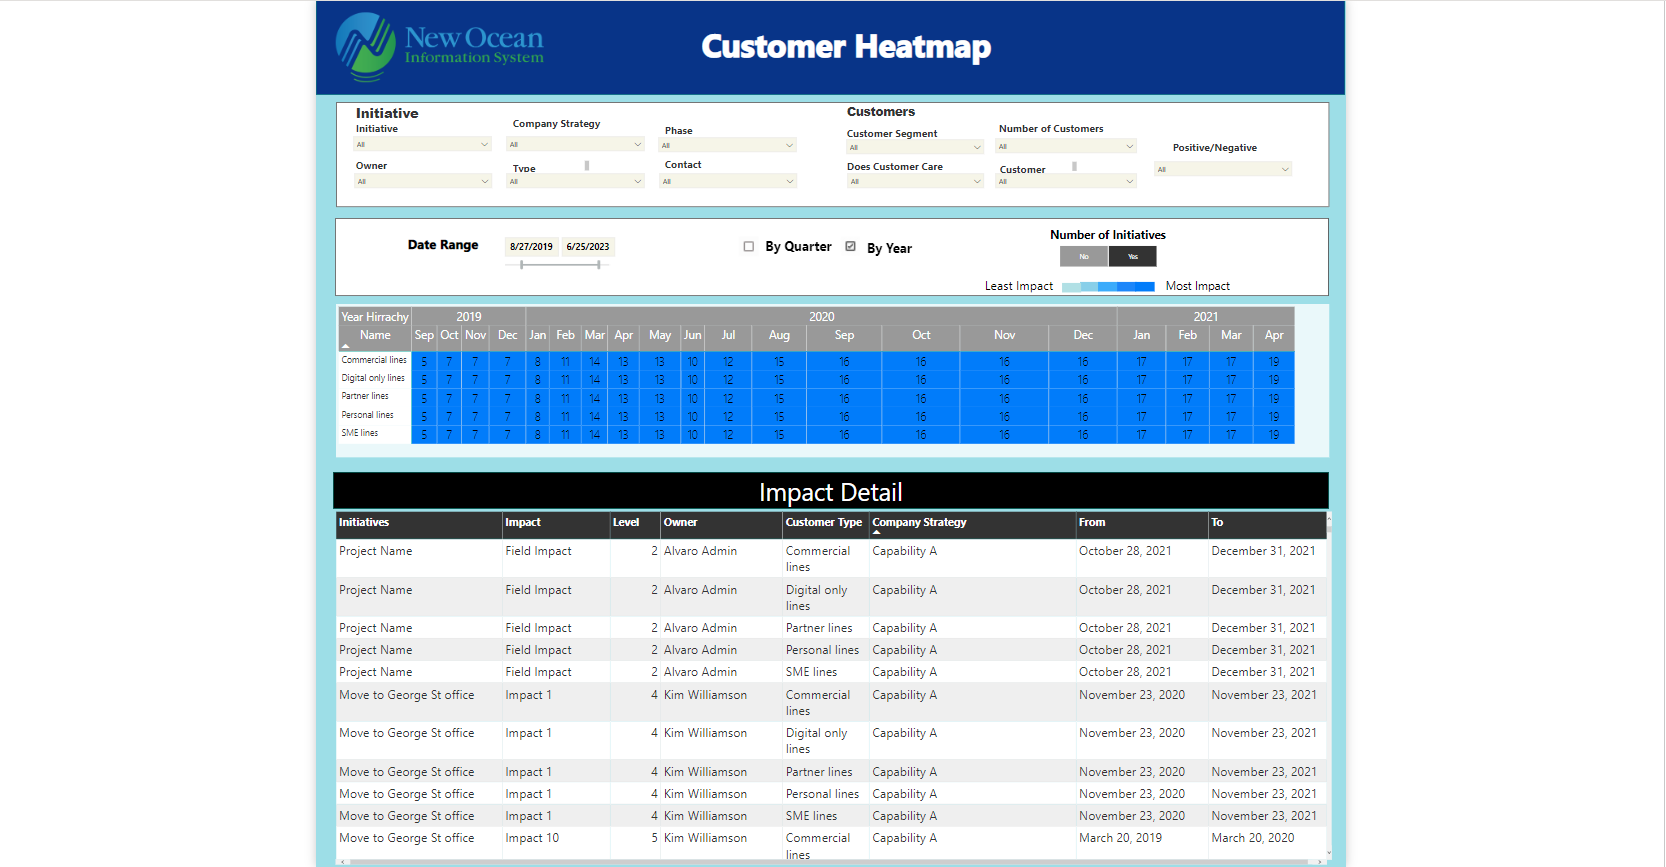
In order to track business activities specifically, Company must understand the network of each customer. The heatmap report by customer gives us a clear view of the influence each customer has on the revenue scale of the business, see the percentage of each customer's revenue. The report gives businesses a comprehensive solution to track the impact of each company's customers.Therefore, there is a view from general to specific for each customer in the business.
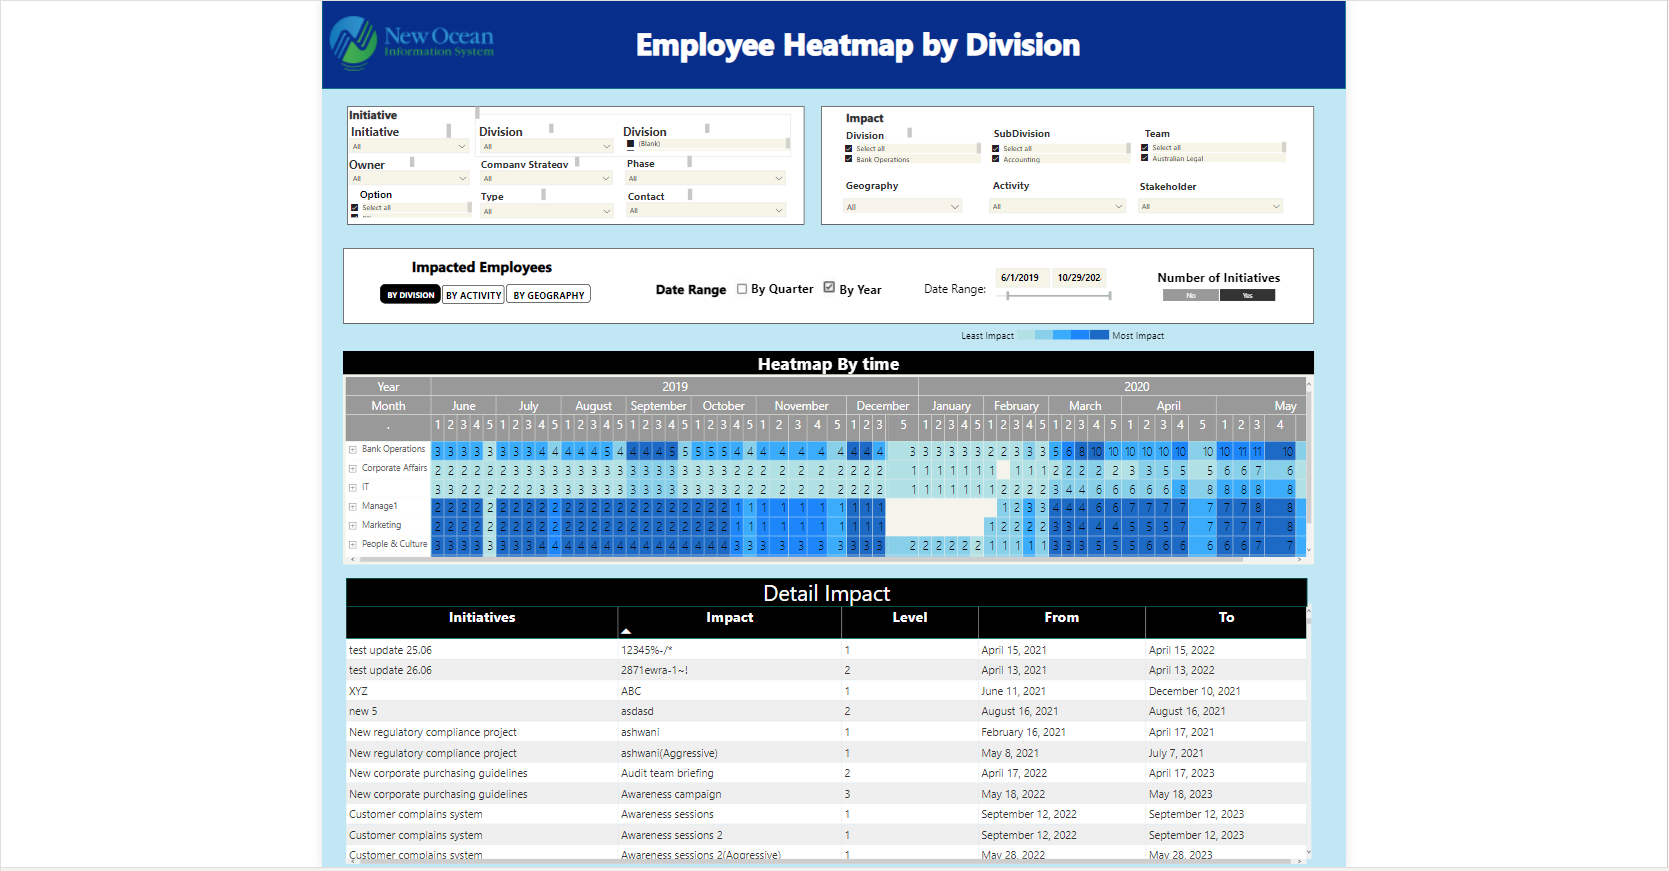
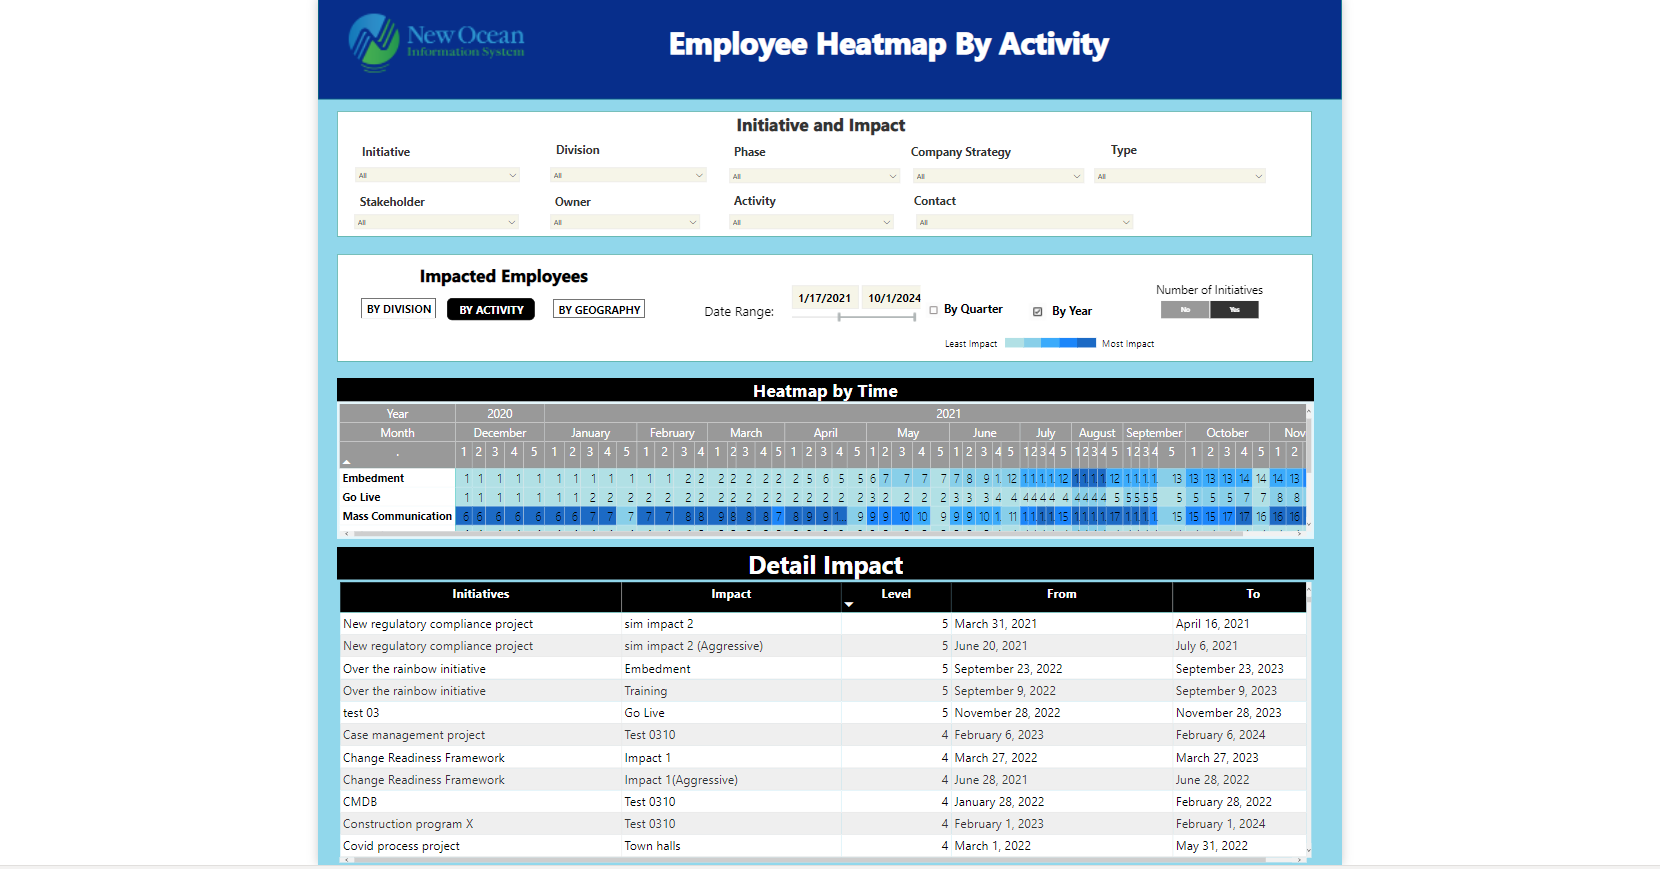
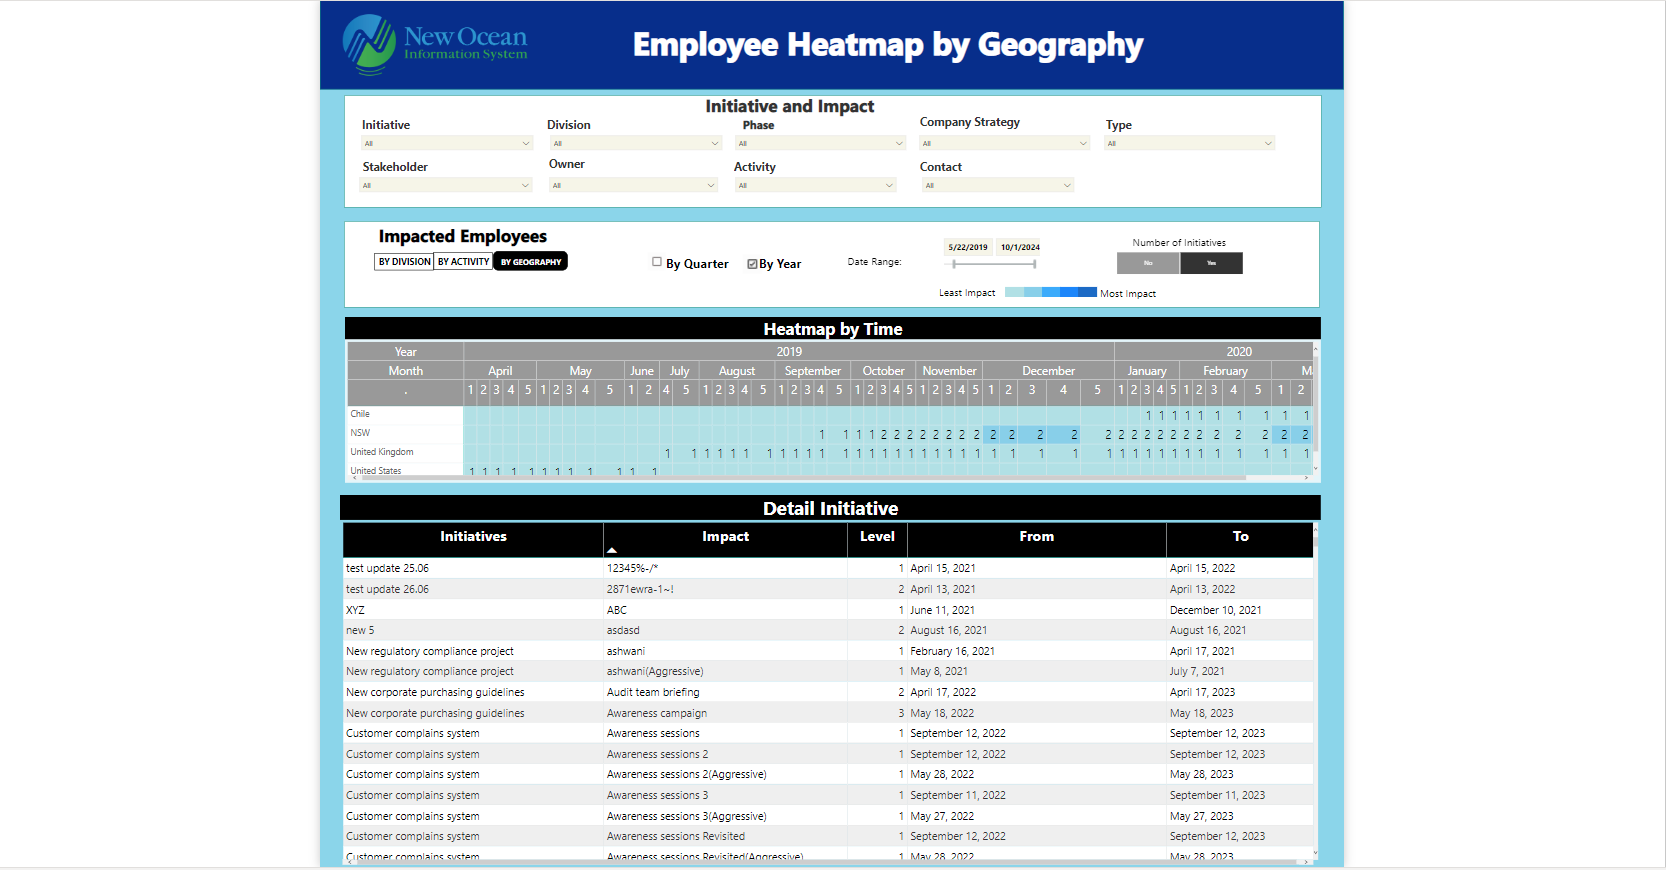
Theseday, there is no doubt that the larger business size, the more complicatedly the managers have to face to solve problems in any strategies. With Power BI, esspecially heatmap, we can not only follow the progress but also evaluate the impacts on many ralational objects such as activities, divisions, geographies and so on. Therefore, the managers can make more better decisions to help company generate more profit as well.
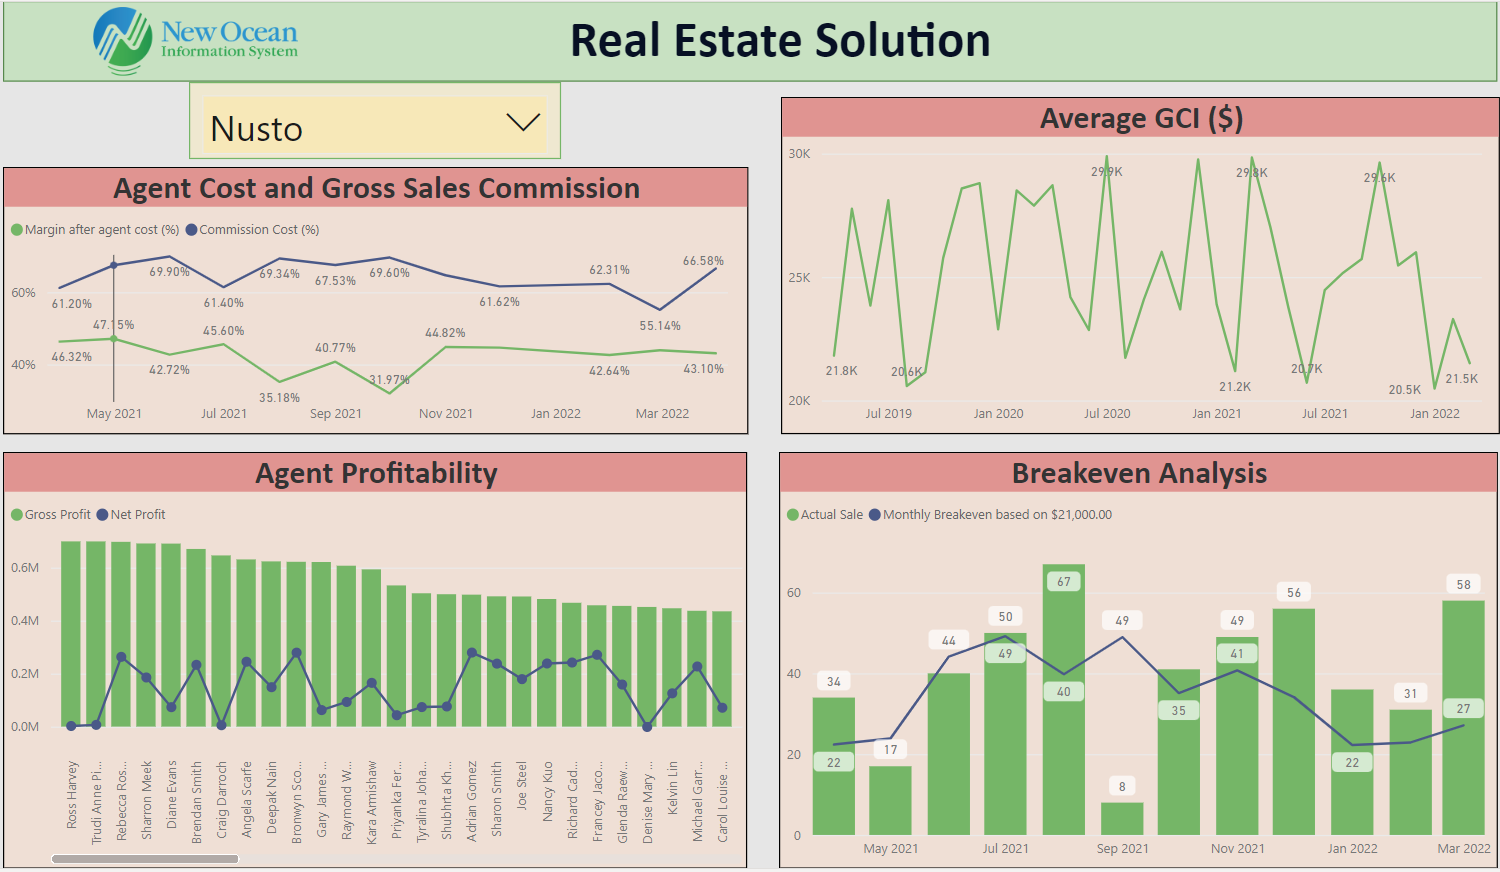
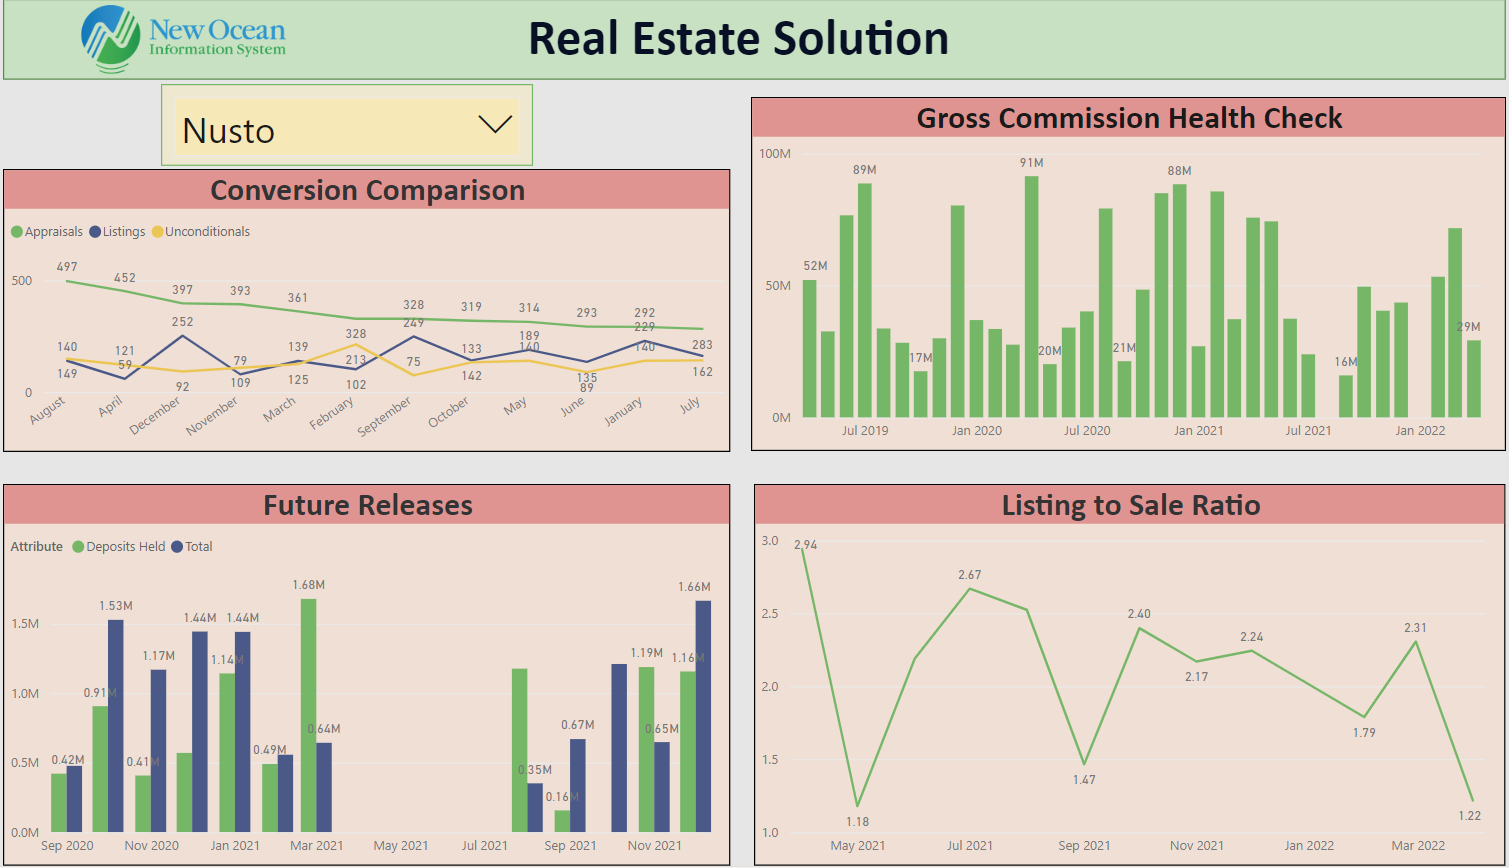
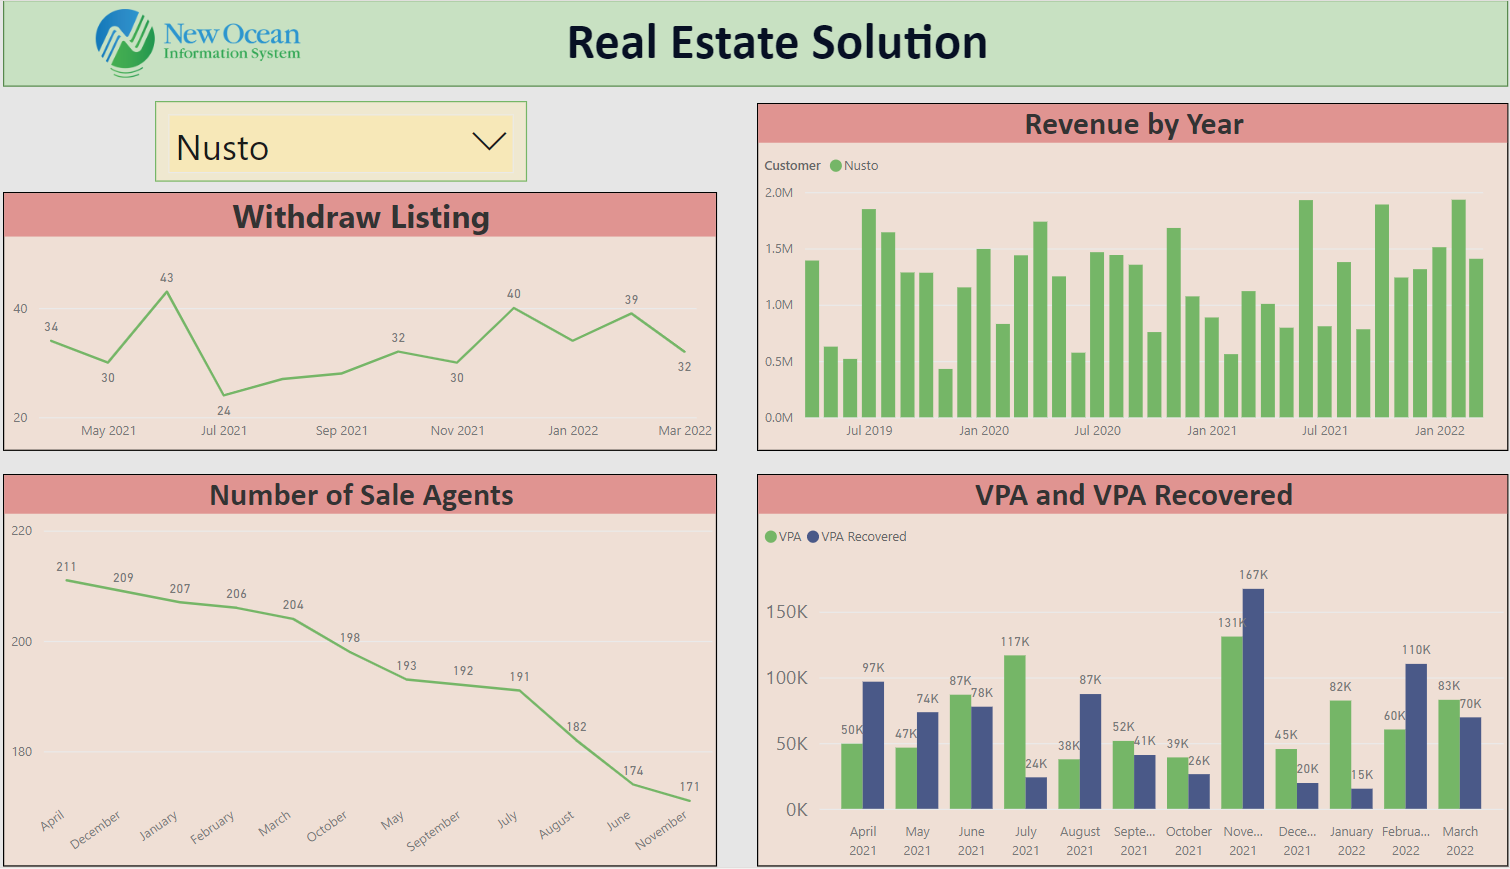
Real Estate is always one of the riskiest majors to not only investors but also other companies, therefore both of them need an overview and a deep insight before making any decision to minimize potential risks. If you are a real estate company looking for an optimal solution to evaluate KPIs, New Ocean IS can be a golden partner with over 10-year experience working with many domestic and foreign companies. We understand your problems and can combine with Power BI to visualize your data into charts so that you can easily evaluate the market and your company status to make more suitable strategies playing an important role in generating profit for your company.